Native Vegetation
Over the past ten years, we’ve been monitoring and evaluating how water for the environment supports the Murray–Darling Basin’s unique, diverse, and iconic vegetation. Here, we share the key insights and lessons learned to inform future water management and ecological planning.
Image: Swamp buttercup (Rununculus inundatus), a species that usually requires flooding for more than 3 months per year, but can survive periods of damp and drying ground.
Flows for vegetation
Over the ten years (2014-24), Commonwealth water for the environment has played a vital role in maintaining healthy plant life across the floodplains and wetlands of the Murray–Darling Basin. Our research has identified different distinct groups of vegetation; each associated with different inundation regimes. These wetter regimes have sustained a richer variety of vegetation, particularly submerged, amphibious, and damp-loving species that would struggle to persist under drier conditions.
Our overall monitoring to date shows that water for the environment plays a critical role in increasing the diversity, cover and resilience of submerged, amphibious and damp-loving species and reduces the risk of a permanent transition to altered community assemblages.
Note: The contents on this page includes summarised text from the following report: Basin-scale evaluation of 2023–24 Commonwealth environmental water: Vegetation. Page number references have been noted throughout the content below for anyone using the full report.

Our approach
The evaluation is based on vegetation data collected under the Long Term Intervention Monitoring Project (2014–15 to 2018–19) and Flow-MER Program (2019–present) from floodplains, wetlands and river channels. The evaluation is to build our understanding of the relationship between environmental water and vegetation species and communities.
This was achieved using a counterfactual modelling approach. In simple terms, this meant comparing the plants that were observed at 73 monitored floodplain and wetland sample sites over the 10 years to the plants that were expected to be present at these sites without environmental water. This approach was based on the relationship between inundation regimes (how often, how long, and how variably sites were flooded). This allowed us to compare vegetation outcomes with and without water for the environment, focusing on both species richness and the structure of plant communities. We paid particular attention to functional plant groups like submerged, amphibious, and damp-loving species, which are especially influenced by water availability.
Commonwealth environmental watering actions are often managed in partnership with states and other environmental water holders. In these cases, outcomes cannot be apportioned with current methods, and evaluation is for the combined management of environmental water, not Commonwealth environmental water alone.
What have we learned?
We used the inundation history at each of the 73 floodplain and wetland sample points to identify 4 unique inundation groups using a statistical approach called clustering. Inundation Groups 1 to 4 represent a gradient of flooding frequency and duration, from near-permanent inundation to infrequent wetting events. Over the 10 years of monitoring, these groups showed that hydrological regimes strongly influence vegetation structure and function.
Characterised by a mix of submerged, amphibious and damp-loving species, such as spike-rushes, old man weed and slender knotweed. Few terrestrial or woody flood-dependent species are identified as characteristic.
This group consisted of 10 sample points from the Murrumbidgee River System and 4 from the Lachlan River System. Over the 10-year period, sample points in Inundation Group 1 experienced 4 dry phases and stayed dry for 5 months on average. The average maximum dry phase was 9 months.
Characterised by species that include narrow-leaved cumbungi and another of the spike-rush family, flatspike-sedge.
This group was inundated in 42.5% of quarters. This group experienced 6.2 flood events over this 10-year period, which had an average duration of over 8 months and average maximum inundation duration (longest flood) of nearly 2 years. Inundation Group 2 had an average dry phase of nearly one year and an average maximum dry phase of nearly 2 years. Inundation Group 2 consisted of 21 sample points from the Gwydir River System and one from the Murrumbidgee River System.
The 2 driest groups (Inundation Group 3 and Inundation Group 4) are characterised predominantly by the woody flood-dependent tangled lignum. The wetlands of Inundation Group 3 also displayed a relatively diverse array of damp-loving and terrestrial species such as old man weed, blue rod, hairy carpetweed.
This group was inundated in 45.1% of quarters. This group experienced 3.6 flood events over this 10-year period, and each flood event had an average duration of 1.5 years and average maximum duration of a little over 2.5 years. Inundation Group 3 had an average dry phase of 1.5 years and an average maximum dry phase of nearly 3.5 years. Inundation Group 3 had an average dry phase of a little over 1.5 years and an average maximum dry phase of 3.5 years. Inundation Group 3 consisted of 21 sample points from the Lachlan River System and one from the Murrumbidgee River System (Figure 3.9)
The 2 driest groups (Inundation Group 3 and Inundation Group 4) are characterised predominantly by the woody flood-dependent tangled lignum.
This group was inundated in 21.8% of quarters and while characterised by prolonged dry phases (average duration of dry phase of nearly 2.5 years and average maximum dry phase of more than 3.5 years, it experienced 4.1 floods over the last 10 years. Once flooded, these sample points remained inundated for 6 months. Inundation Group 4 consisted of 15 sample points, of which 7 were from the Lachlan River System and 8 from the Junction of Warrego and Darling rivers.
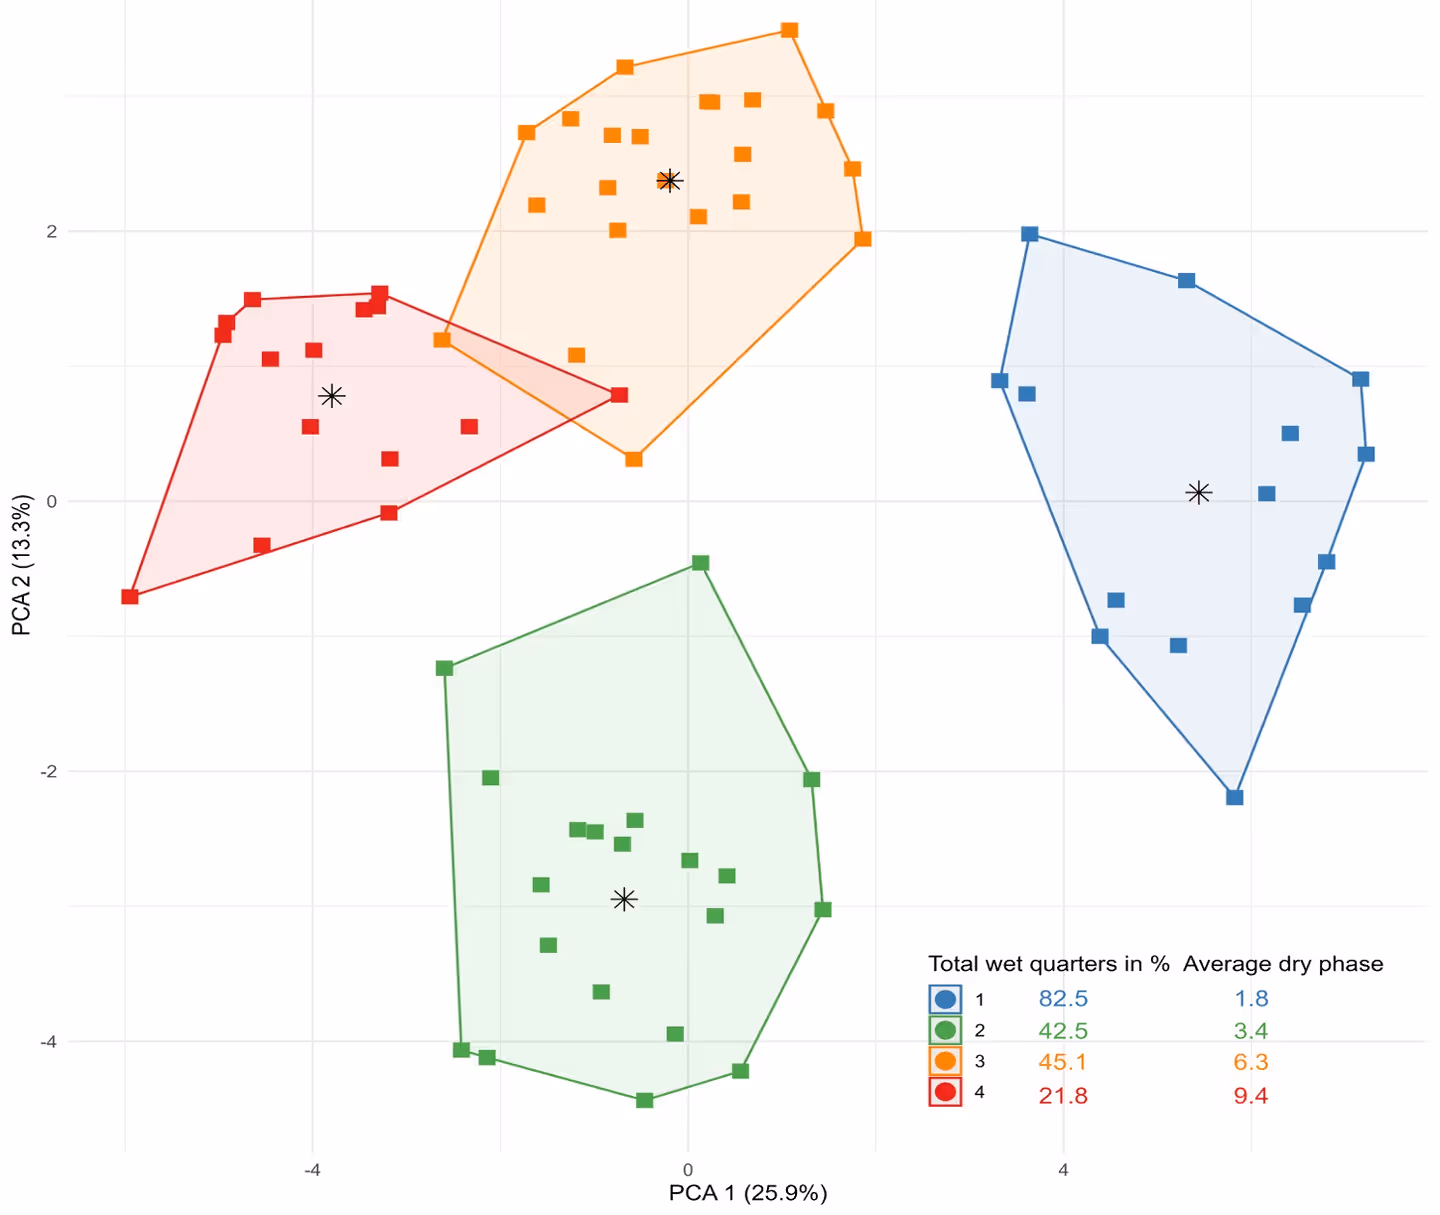
PCA = Principal component analysis Key: Inundation Group 1 = near-permanent water and an average dry-phase duration of 6 months, Inundation Group 2 = short, frequent inundation, with average duration of inundation of 6 months and an average dry phase of 9 months, Inundation Group 3 = longer duration and less frequent inundation with an average duration of inundation of 1.5 years and an average dry phase of 1.5 years, and Inundation Group 4 = short duration and prolonged dry phases, with an average inundation duration of 6 months and an average dry phase of 2.5 years. The star symbol represents the centroid of each cluster. The filled squares show the sample points with environmental water and are assigned to the most similar cluster. Overlap of clusters is the result of multi-dimensional data being plotted in 2 dimensions.
Lower Murray River data are excluded from calculations of species cover, as they record data as species frequency at 3 sample points in 2019–20, 2020–21 and 2023–24.
The counterfactual: without environmental water
The counterfactual modelling conducted as part of the evaluation demonstrates that, without Commonwealth environmental water, the vegetation condition and diversity across the Murray–Darling Basin would have been significantly degraded.
Without environmental water, sample points from Inundation Group 1, Inundation Group 2 and, to a lesser extent, Inundation Group 3 would have been drier. Nearly all inundation groups would have experienced a flooding regime more similar to Inundation Group 3.
In the absence of environmental water, nearly all sites currently in the wetter inundation Groups 1 and 2 (which show greater biodiversity and unique functional assemblages) would have lost these features. Specifically, there would have been a near absence of submerged species and a substantial reduction in amphibious and damp-loving plants, which are unable to survive extended dry phases. For example, Inundation Groups 3 and 4 experienced dry periods lasting on average between 1.5 and 2.5 years (the average maximum was 3.4 years). This exceeds the known dry-phase tolerance of many submerged or amphibious species such as eelweed (Vallisneria australis) leading to their localised extinction. This shift would have led to:
- A homogenisation of vegetation communities, dominated by drought-tolerant terrestrial and woody flood-dependent species.
- A loss of unique vegetation structure and habitat complexity in both wetland and floodplain environments.
- A reduction in culturally significant plant species used by First Nations communities, many of which require regular or semi-regular inundation to persist.

The plot shows how the sample points would cluster differently without environmental water.
Functional Group Composition
Submerged
Species that either require permanent water in the root zone or those that live in the water column.


Amphibious
Species that either respond to, or tolerate, the presence of surface water. These species usually require flooding for more than 3 months per year, but can survive periods of damp and drying ground.


Damp
Species that germinate and establish on saturated or damp ground, but the adult plants don’t tolerate flooding. They grow on ground that has been flooded.


Woody Flood Dependent
Perennial trees or large shrubs that require flooding to complete part of their life cycle.


Terrestrial
Species with no flooding requirement.


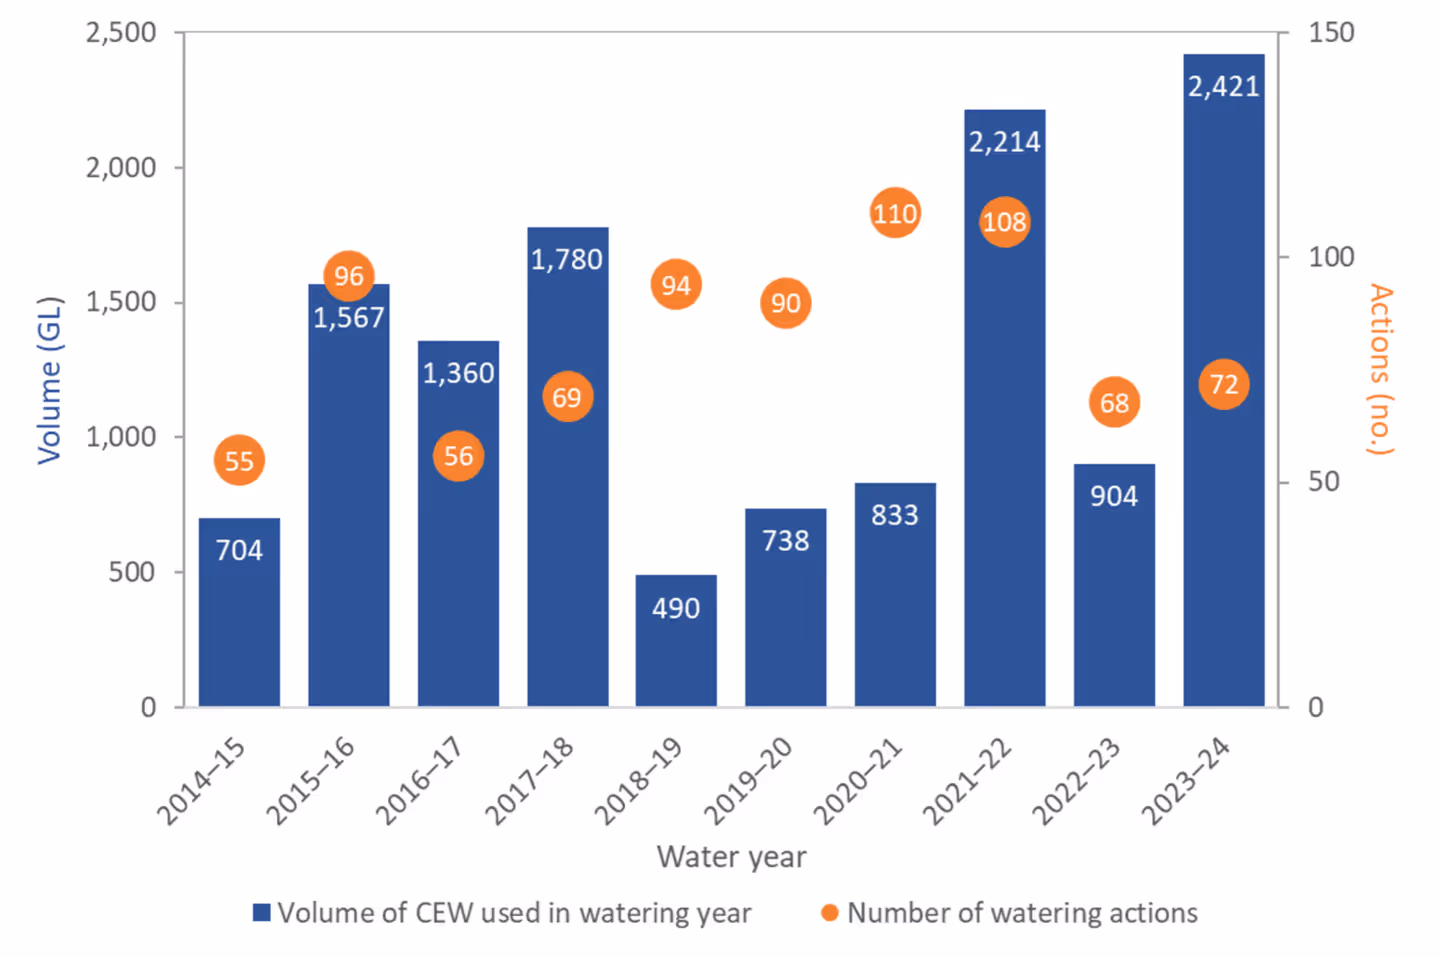
Commonwealth Environmental Water Delivery
Water Year 2023-24
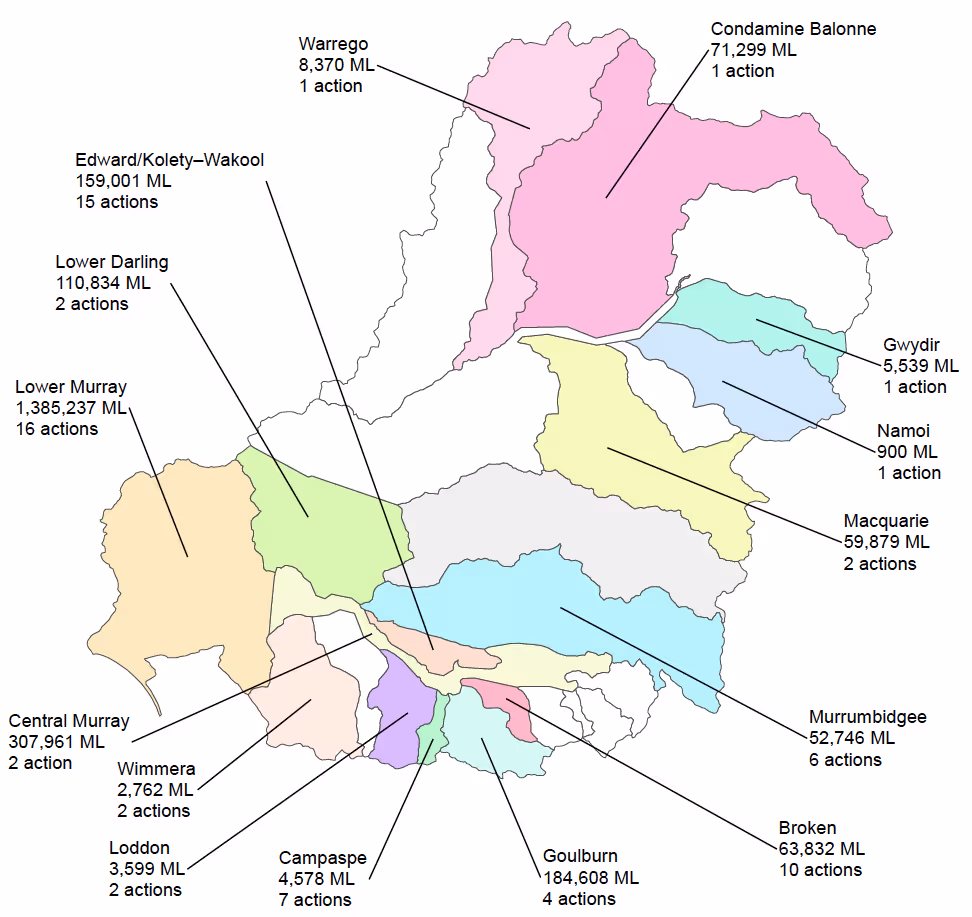
More than 2,400 GL of Commonwealth environmental water was delivered over 72 actions with expected outcomes for vegetation across the basin.
- Half (36) of these 72 actions were delivered in combination with one or more other environmental water sources.
- 43 actions (involving 1,795,501 ML of CEW) were delivered for vegetation outcomes into the Selected Areas in which groundcover vegetation outcomes were monitored.
Watering Actions
Water Years 2014-24
Since 2014 to 2024, 818 watering actions involving Commonwealth environmental water targeted expected outcomes for vegetation. Of these actions, 630 were in Selected Areas, the majority within the Lower Murray River (364) and Murrumbidgee River System (105) Selected Areas. The number of watering actions varies each year in relation to water availability, and local and regional priorities
Understanding vegetation outcomes
Water for the environment is used for a range of expected outcomes for vegetation.
Condition refers to the overall health or quality of vegetation. Although species richness declined due to persistent high water, native taxa proportion and cover remained stable over 9 years (~71–74% richness, ~79–96% cover). This suggests core ecological functions like productivity, habitat provision, and weed resistance are being maintained (p. 28).
Extent refers to the area occupied by vegetation. Over 10 years, the evaluation shows that without Commonwealth environmental water, key species assemblages would shrink significantly, leading to reduced vegetation richness, permanent shifts in community composition, and a substantial decline in the resilience of water-dependent plant communities (p. iv).
Natural regeneration is the natural regrowth of existing vegetation to replace plants which have died. We found that species that rely on periodic inundation for germination and growth, like nardoo, cumbingi, and spike rush, were more prevalent at sites with environmental water. This indicates regeneration and recruitment processes were supported at these locations (pg 37).
Germination is the process by which a plant grows from a seed into a seedling. Seeds tend to remain dormant until conditions are favourable for germination. Water for the environment has played a critial role in maintaining the soil seedbank and rhizomes so that these plant species could take advantage of wetter conditions (pg 29).
In-stream habitat describes aquatic vegetation, as well other components like wood and rock that maintain the health of a waterway. Noticeable differences were observed in 2022–23 vegetation assemblages at sites with wetter inundation regimes supported by environmental water, helping maintain key components of aquatic habitat (p. v).
Saline soils are those that contains enough soluble salt to adversely affect the growth of plants and prevent them from regenerating.
We examine how water for the environment can prevent the death and/or decreasing condition of vegetation.
The roots of vegetation maintain plant root mass, which helps to limit erosion, improve soil stability and contributes to soil fertility.
Our work identifies specific plant species that provide adequate cover and protection for bird nests and help provide a food source.
Restoration and recovery include improving the health of existing vegetation. Environmental water is preventing the loss of characteristic wetland and floodplain plants by maintaining wetter hydrological regimes which helps maintain biodiversity across the Basin (pg 6).
Resilience describes the ability for vegetation to recover after a decline. Without water for the environment, vegetation community richness would decline, increasing the risk of permanent shifts to altered assemblages and reducing the resilience of water-dependent plant communities (p. iv).
Inundate habitat is the delivery of water to inundate instream and/or riparian habitat. Commonwealth water for the environment has maintained distinct inundation regimes, delivering water to allow submerged and amphibious species to persist and thrive even after prolonged natural flooding. (pg. iv)

Photo Ben Vincent.
Vegetation Evaluation
2023–24
- 360 plant taxa were recorded in 2023–24 across all floodplain, wetland and riverine monitoring locations
- Fifty-four taxa known to be used by Aboriginal people were recorded in 2023–24. These plants are used for food (21 taxa), fibre and shelter (including dye, glue and resin; 2 taxa), medicine (5 taxa), fishing and hunting (1 taxon), ceremonial or dreaming/ storytelling (1 taxon).
- Ninety-one sample points were surveyed in 2023–24, which is the greatest number of sample points visited in a watering year in the past 10 years of the program
- Most (~70%) plant taxa recorded in 2023–24 were native, and ~87% of the plant cover at sample points comprised native plant taxa.
- There was a greater proportion and cover of submerged and amphibious plants observed at sites that had wetter inundation regimes maintained using environmental water.
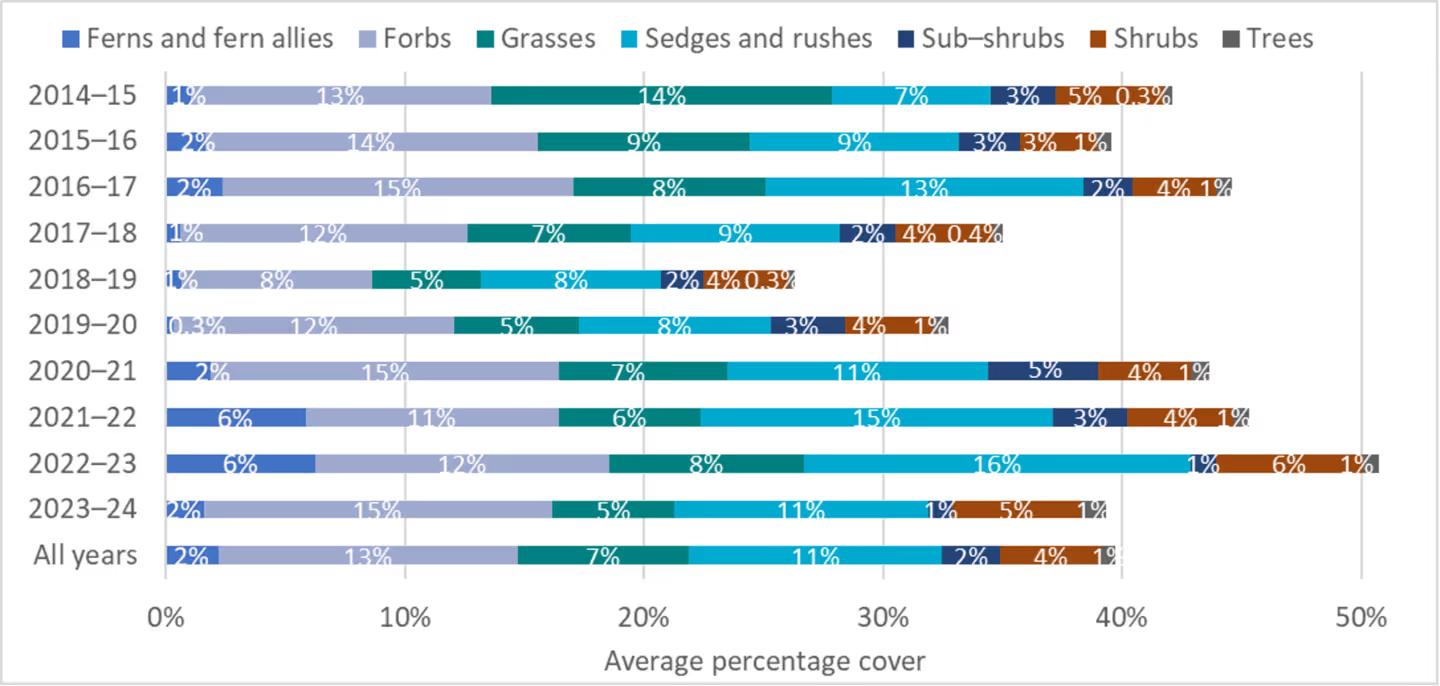
- The dominant functional group by standardised average cover in 2023–24 was amphibious (13% cover), followed by damp-loving (10%), woody flood-dependent (6%), terrestrial (6%) and submerged (4%)
- Fifteen previously unrecorded taxa were detected in 2023–24
- It is very likely that in the absence of environmental water, there would have been a near absence of submerged species, and considerably less diversity and cover of amphibious and damp-loving species at 38% of monitored sample points.
2014-24
- In total, 804 taxa were recorded across all Selected Areas from 2014– 2024. More than 13,000 plant species are listed in the Atlas of Living Australia as having been recorded within the Basin, and around 8,000 recorded from the managed floodplain
- The recording of 804 taxa in the Flow-MER Program is notable given the total sampled area is approximately 3.6 hectares or 0.0001% of the managed floodplain
- Average taxon richness fluctuated between 2014–15 and 2023–24, likely in response to both weather conditions and the use of environmental water. Average taxon richness recorded at sample points declined from 2014–15 to 2018–19 as conditions across the Basin became increasingly dry, followed by increases in 2019–20 and 2020–21. Average taxon richness then decreased to be the lowest average recorded to date in 2022–23.
- The majority of plant taxa–in terms of both numbers of species (70%) and total cover (86%)–recorded across all sample points and all 10 years were native.
- The greatest proportional cover of native taxa was recorded over the last 3 years (92% in 2021–22, 96% in 2022–23 and 87% for 2023–24)
- The proportion of native species recorded varied little between years but was greatest during the 2 wettest years, 2021–22 and 2022–23 (74% and 73% respectively), suggesting the extended wet conditions favoured native taxa
- In total,101species in the 2014–24 dataset are listed on national species lists
- Seventy-seven plant taxa known to be used by Aboriginal people of the Basin have been recorded over the past 10 years (2014–24). These 77 plants have a range of uses, including as food (33), fibre and shelter (including dye, glue and resin) (5), medicine (7), hunting or fishing, messages and boundaries, dreaming/storytelling or ceremonial, and basketweaving.
What does this mean for water managers?
The 2023–24 Basin-scale vegetation evaluation provides clear evidence that environmental water continues to play a critical role in sustaining ecological function and biodiversity across the Murray–Darling Basin. The evaluation highlights that managed water remains essential to maintain vegetation health, extent, and diversity—particularly in floodplain and wetland environments. The following messages summarise the most important insights from the evaluation to guide environmental water planning and management:
Environmental water is critical to maintaining diverse and functional vegetation
Without Commonwealth environmental water, most sites would have experienced much drier regimes, with significant losses of submerged, amphibious, and damp-loving species (pg 6).
Distinct inundation regimes are essential to ecological outcomes
Vegetation responses and ecological outcomes differ among sites due to variation in watering regimes (Inundation Groups 1–4), each supporting different vegetation communities and maintaining diversity across wetland and floodplain habitats (pg. 13).
Environmental water delivers cultural and biodiversity benefits
In 2023–24, 54 Aboriginal-use plant species were recorded, 33 of these require flooding, including 8 amphibious taxa, 3 submerged taxa, 13 damp-loving taxa and 9 woody flood-dependent taxa.
Watering remains essential even in wet years
Despite natural flooding, distinct vegetation patterns persisted at sites that received environmental water, which buffered against over-inundation impacts and maintained functional vegetation (pg. v).
Monitoring and adaptive management should continue to evolve
There is a need to improve inundation modelling, refining vegetation sampling, and incorporating additional indicators to better evaluate environmental outcomes and guide water planning.
Meeting Basin plan objectives
The Basin Plan sets out a framework to protect, restore and manage the water-dependent ecosystems of the Murray–Darling Basin. It outlines high-level environmental objectives in Section 8.04, supported by specific goals for the protection and restoration of ecosystems (Section 8.05) and their ecological functions (Section 8.06). These objectives guide the planning, delivery and evaluation of Commonwealth environmental water. The 2023–2024 vegetation evaluation demonstrates how environmental watering actions—both annual and cumulative over the past ten years—have made measurable contributions toward these objectives. The following points summarise how the use of Commonwealth environmental water has supported biodiversity, resilience, ecosystem processes, and cultural values across the Basin.

Protect and restore biodiversity, including plant species diversity and ecological character of communities
From 2014 to 2024, Commonwealth environmental watering created and maintained distinct inundation regimes that supported diverse and functionally rich vegetation communities. Greater diversity and cover of submerged, amphibious, and damp-loving species were consistently observed at sites supported by environmental water (p. 33).
Ensure resilience to climate change and other risks
The consistent delivery of environmental water has helped maintain seedbanks, vegetative propagules, and favourable hydrological conditions required for plant survival and recovery. This prevents irreversible transitions to dryland vegetation and supports long-term resilience of water-dependent ecosystems (pg. 33).
Protect and restore ecosystem functions that support water-dependent ecosystems
Environmental watering enhanced regeneration, bank stability, and aquatic habitat quality, contributing to ecosystem function across riparian and wetland environments (pg. 33-34).
Basin Plan Objective: Recognise and integrate Indigenous cultural values in water management
Of the 790 plant taxa recorded since 2014, 79 taxa (10%) only occurred at sites with wetter conditions maintained by environmental water, including 12 culturally significant species known to be used by Aboriginal people. This highlights the role of environmental water in supporting biodiversity with cultural value (pg 34).
Watering remains essential even in wet years
Even during the high rainfall years of 2021–22 and 2022–23, distinct vegetation patterns persisted at sites receiving environmental water, confirming that managed watering delivers additional ecological benefits beyond natural inundation (pg 6).
Recommended adaptive management actions:
Environmental water should continue to be managed to maintain wetter hydrological regimes in floodplain–wetland habitats
- Environmental water is important for maintaining a diversity of inundation regimes across the managed floodplain that in turn support distinct functional and structural assemblages of vegetation.
- It is particularly important that the wetter inundation regimes provided by environmental water are maintained to avoid widespread loss of both species diversity and vegetation community diversity.
There is an opportunity to support plants known to be used by Aboriginal people using environmental water
- While Commonwealth environmental watering actions over the past 10 years have not deliberately targeted plant species because of their cultural significance, watering actions that supported ground cover vegetation have supported a range of plant species known to be used by Aboriginal people.
- There is opportunity to engage with Aboriginal communities across the Basin to identify additional plant species that are culturally important and can be supported with environmental water.
- This could help establish more specific cultural objectives for vegetation outcomes in the Basin, help inform the design of watering actions, and contribute to supporting plant species diversity across the Basin
A stronger focus on, and clarity of, vegetation objectives and expected outcomes is needed
- There is generally poor alignment between the high-level Basin Plan objectives for vegetation, and the more specific, but insufficiently quantified objectives of the annual individual watering actions in the Strategy
- We continue to recommend that objectives for vegetation be better aligned with the over arching frameworks and that more specific (preferably quantified) objectives for individual watering actions be defined, including objectives that reflect the functional role of vegetation in supporting other values
There is a need to improve the accuracy of remotely sensed bimonthly inundation data
Improve the accuracy and resolution of inundation data (especially sub-annual data) and the modelling of counterfactual conditions. Better hydrological data will improve understanding of how vegetation responds to different watering regimes (pg 37).
Improvements to the sampling design are needed to better support evaluation
- Sampling of groundcover vegetation encompasses an area of approximately 3.6 hectares (0.0001% of the managed floodplain), which is a very small sample size given the variation and complexity of the basin
- The sample points monitored as part of Flow-MER were not established to provide replication across ANAE types nor to provide data from the key ANAE types or vegetation communities that are a Basin-wide priority for environmental water
There is a need to establish key hydrological metrics to support the evaluation of vegetation responses on riverbanks
There is a need to provide resources to develop an approach to classifying the hydrological regimes or develop the appropriate hydrological metrics based on in-channel water-level fluctuations that could support the evaluation of vegetation outcomes at a Basin scale within this context.
The inundation-classification approach provides an opportunity to consider appropriate watering regimes to support vegetation within Australian National Aquatic Ecosystem types
The inundation-classification approach used in this evaluation has the potential to be developed further to establish key metrics around the appropriate hydrological regimes for the vegetation communities that occur within different ANAE types.

%20flowers-%20(photo%20credit-%20Rebekah%20Grieger).avif)
%20.avif)