River Flows and Connectivity
Over the past ten years, the River Flows and Connectivity Theme has worked to quantify the contribution of Commonwealth environmental water to protecting and restoring more natural flow regimes and connectivity within and between water-dependent ecosystems.
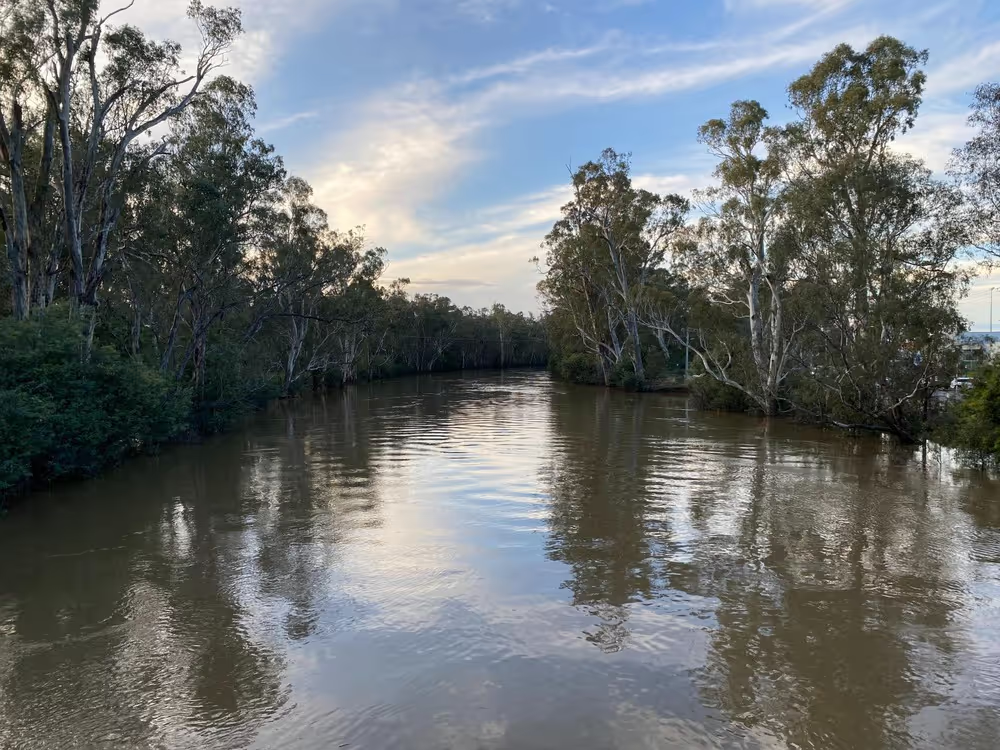
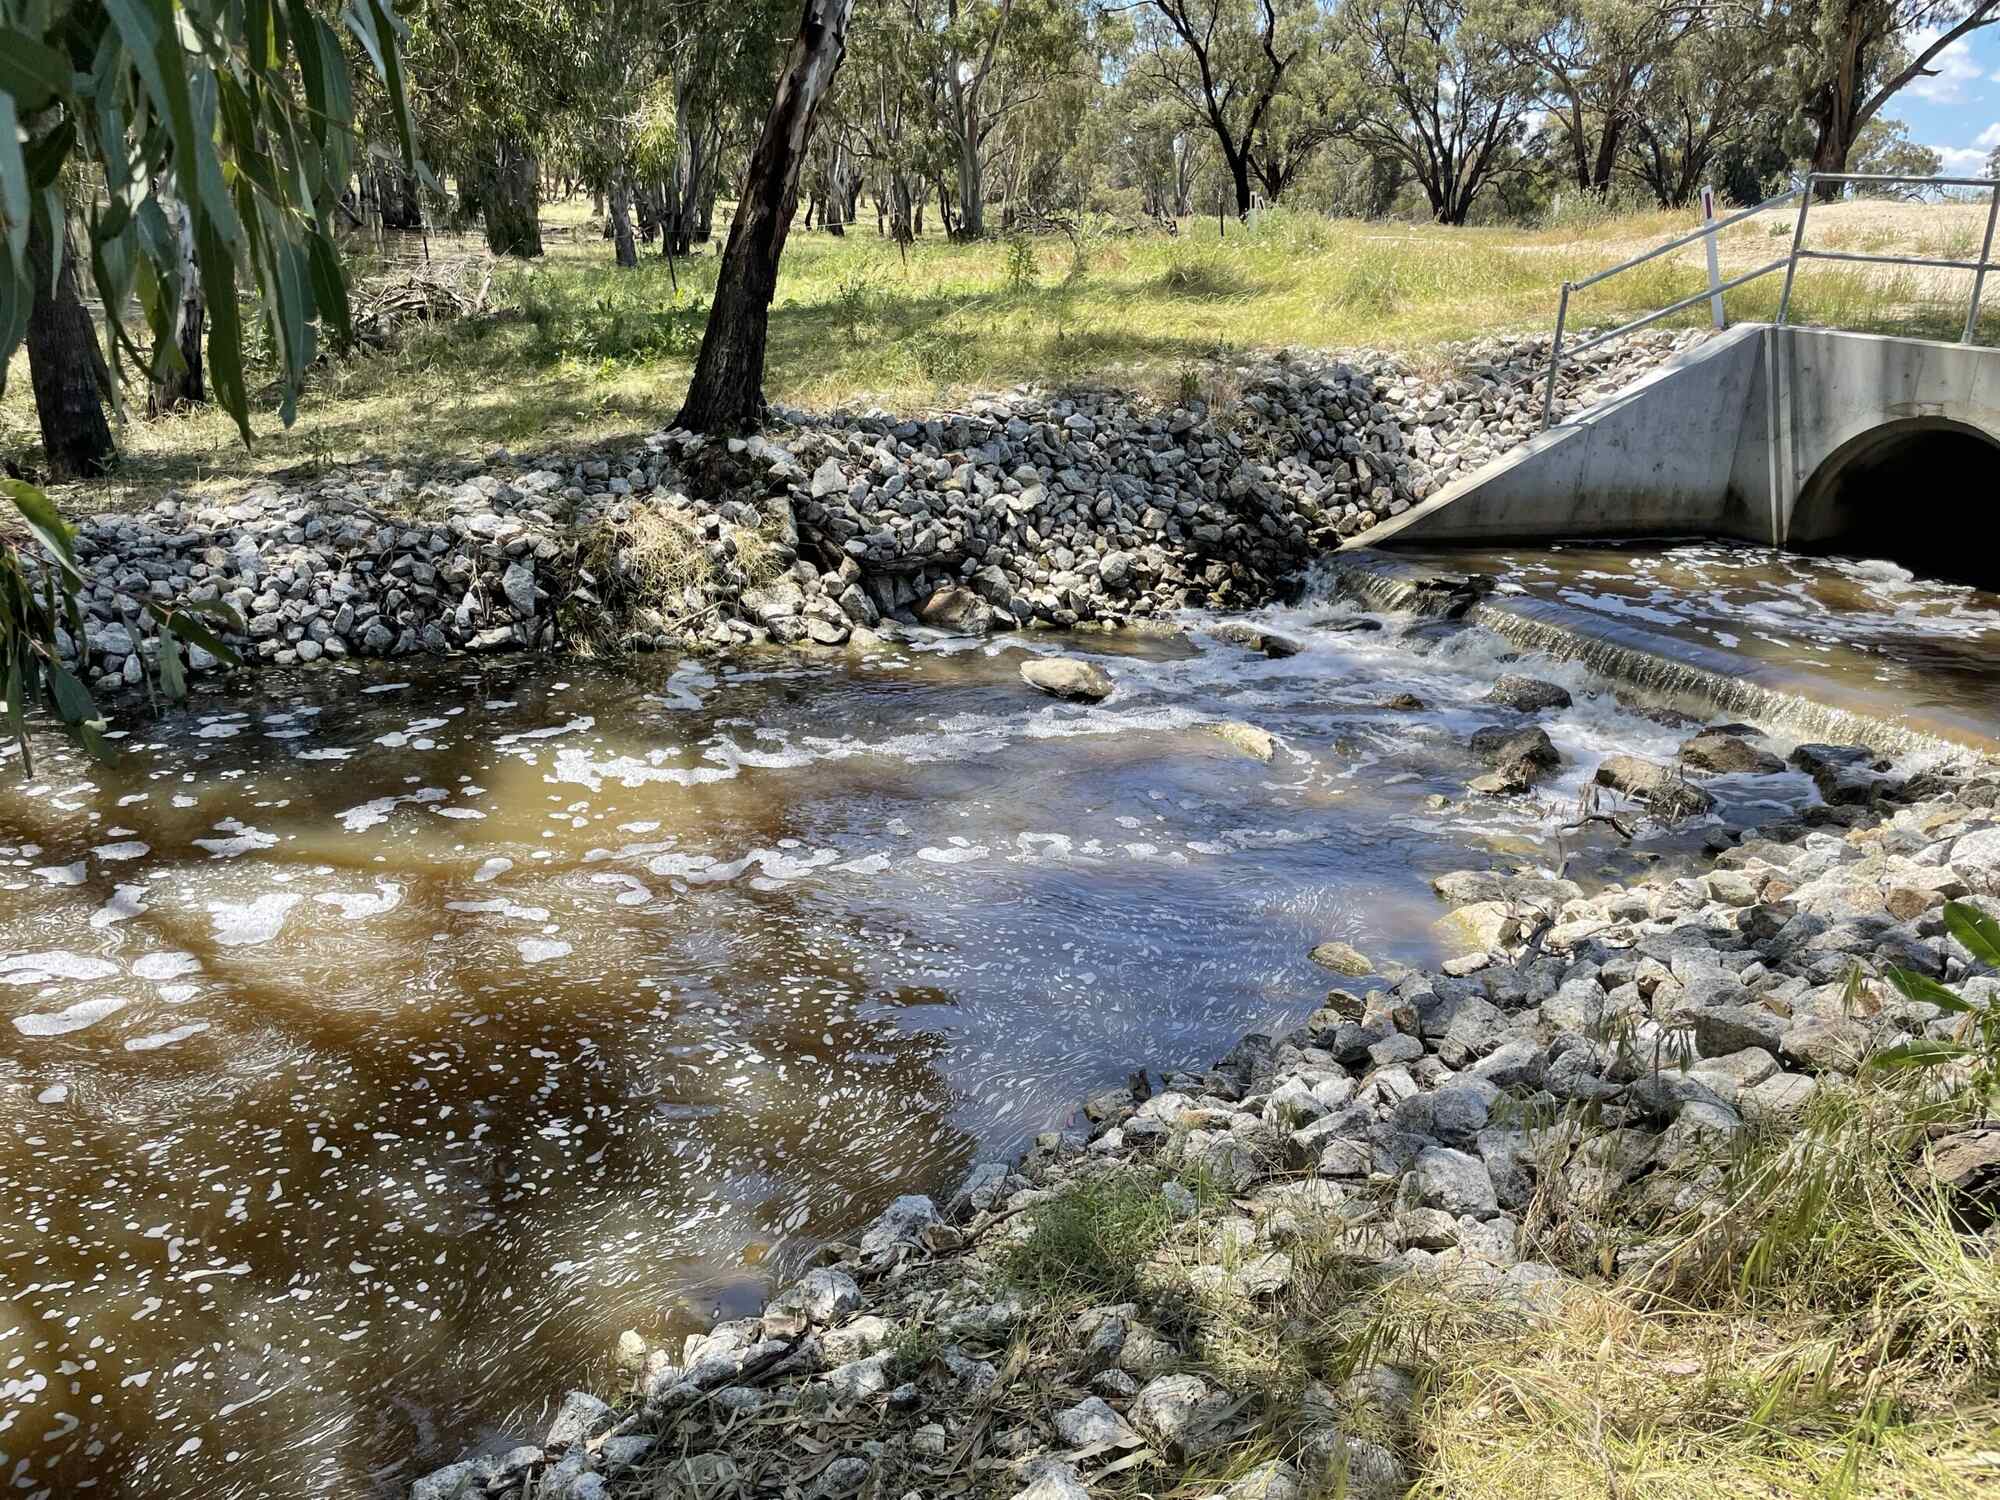
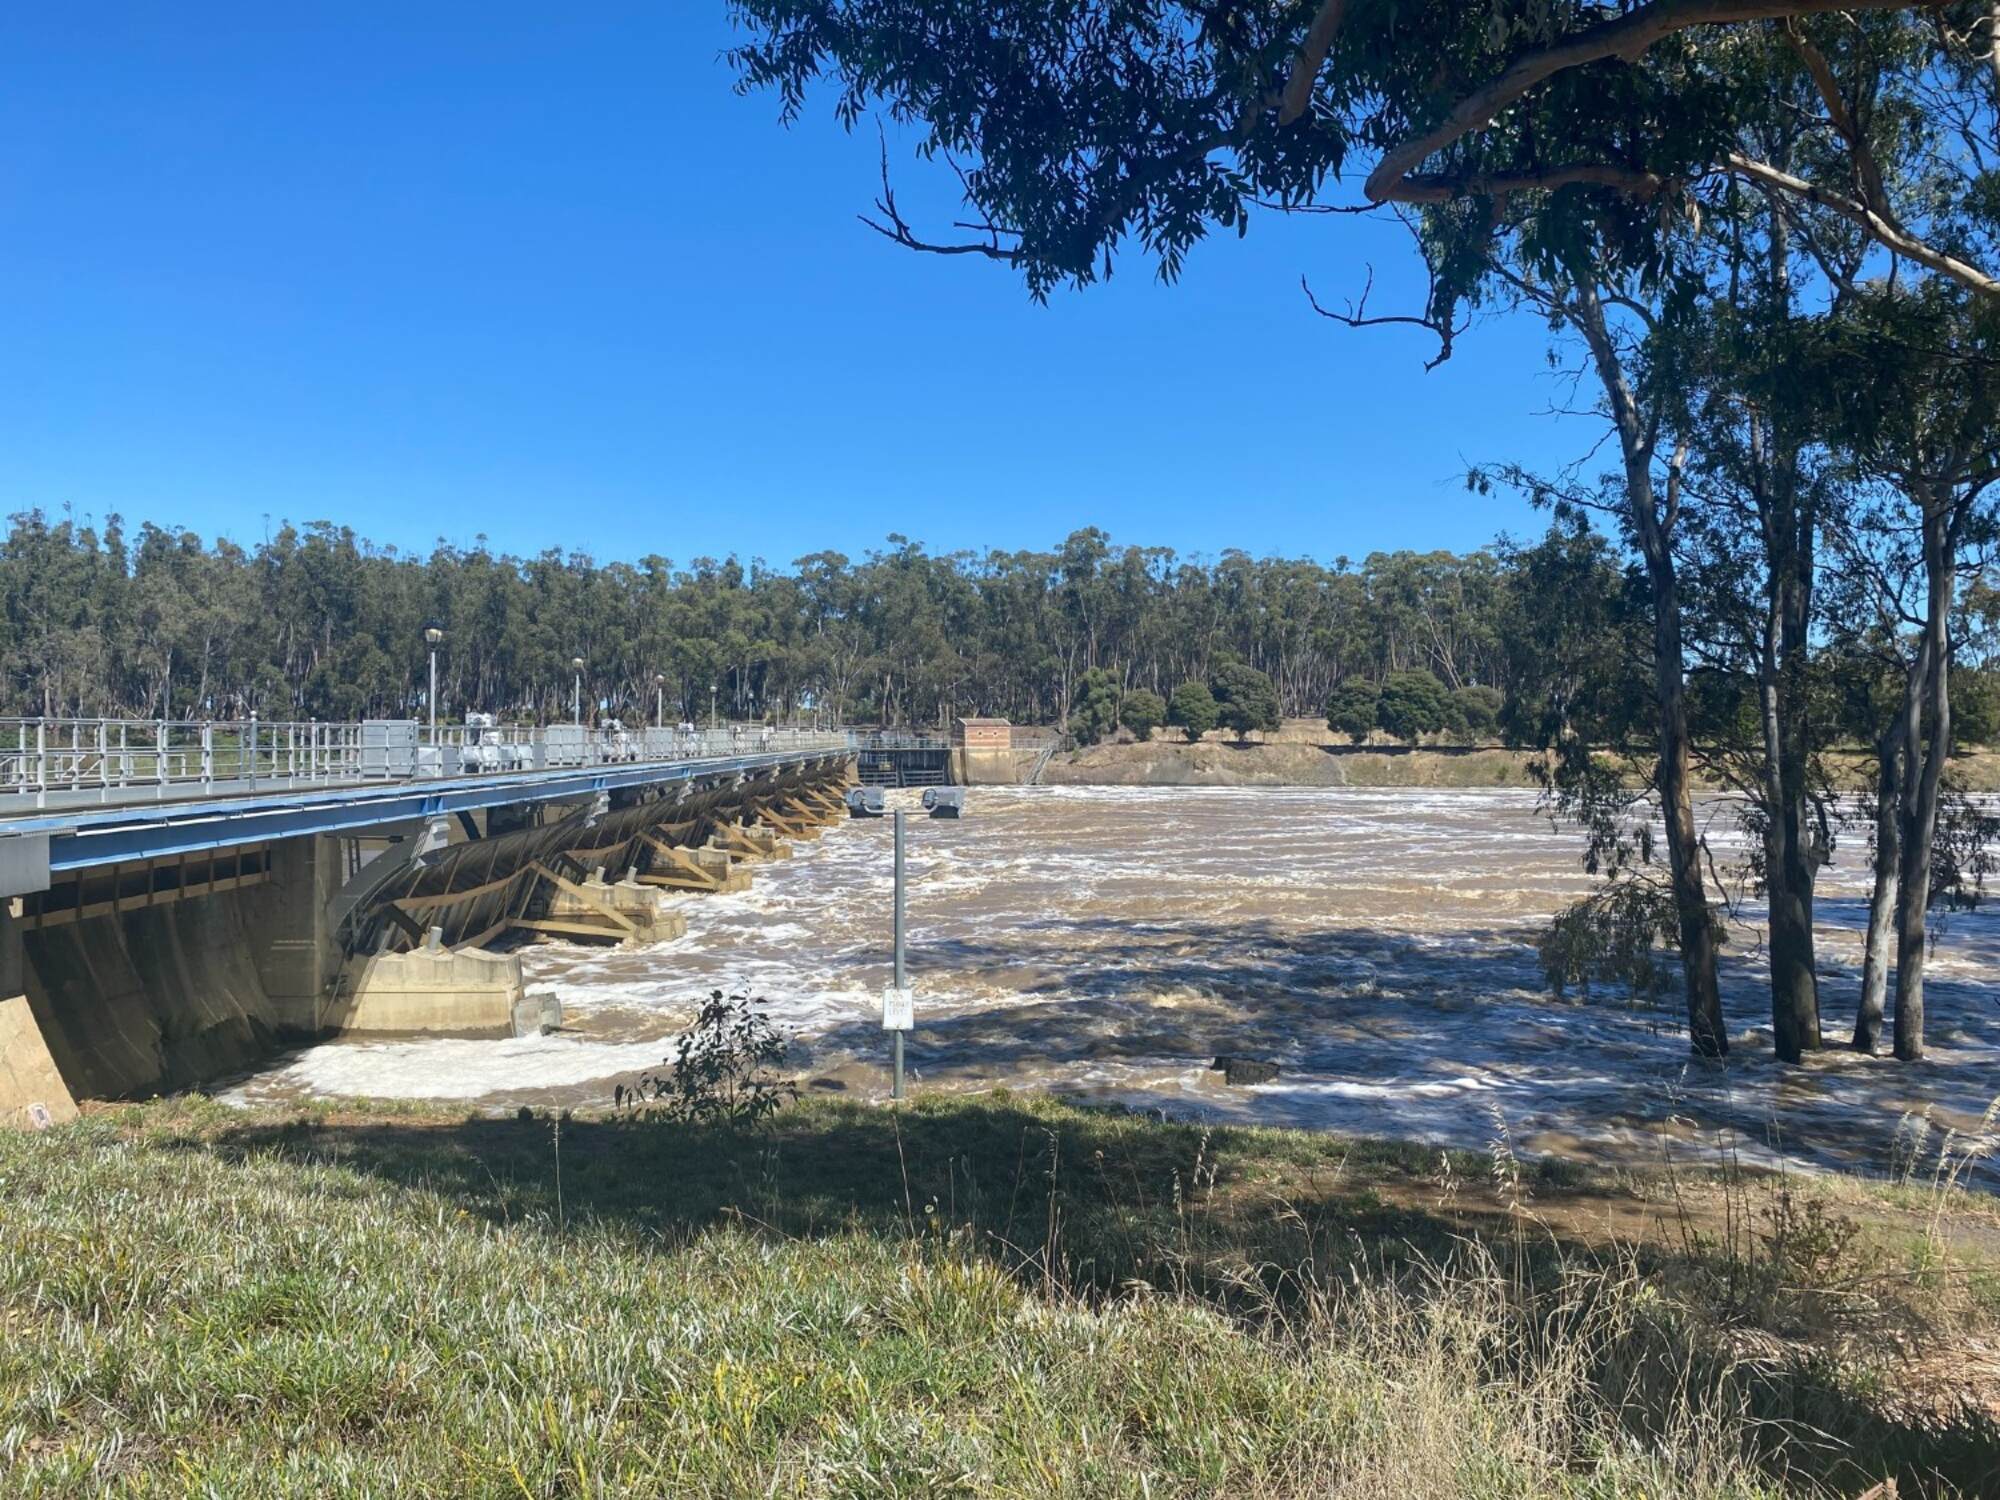
Image: Flooded creek in Yanga National Park, NSW. Photo credit: Tanya Doody
Introduction
Water is the lifeblood of the Murray–Darling Basin, supporting a vast array of biologically rich rivers, lakes, wetlands and floodplain ecosystems – from the headwaters in southern Queensland and the eastern highlands, to the estuary and river mouth in South Australia. In Australia, where river systems are highly variable, understanding river flows and connectivity begins with an understanding of climatic factors such as rainfall patterns, annual weather variability, and runoff. In more regulated systems, like the Murray–Darling Basin, this also includes how water flows are actively managed.
The River Flows and Connectivity Theme assesses how Commonwealth environmental water is contributing to the restoration, improvement, and maintenance of flow regimes, while also enabling vital connections along rivers and between rivers and their floodplains. This theme underpins the evaluation of other ecological themes, such as Vegetation, Biodiversity, and Fish, by providing essential context about water movement and availability.
Note: The contents on this page includes summarised text from the following report: 2023-24 Basin-scale evaluation of Commonwealth environmental water: Hydrology. Page number references have been noted throughout the content below for anyone using the full report.

Commonwealth environmental water delivery
The delivery of Commonwealth environmental water is separated into these Watering Actions.
Watering Actions
Base flows
Base flows are flows in a system not impacted by runoff, or flows sustained by seeping groundwater.
Freshes
(In-stream) freshes are small-to-medium flow events that fill the river channel
Overbank flows
Low and medium overbank flows are substantial flow events that spill onto the low-level parts of the floodplain, including depressional wetlands. Large overbank flows inundate substantial parts of the floodplain including higher areas.
Wetland watering
Wetland watering actions target specific wetlands with pumped flow rather than natural passing flow that might inundate a wetland naturally.

Expected Outcomes
The above watering actions are used to deliver one or more of these outcomes.
Water year: 2023-24

Total Water Delivery
In the 2023-24 watering year, 2,870 GL of Commonwealth environmental water was delivered through 114 watering actions. Of the environmental watering actions, 88 were delivered for instream flows, 21 for wetlands and 5 were a combination of instream and wetland.
- Length of watercourses watered- 21,075km
- Area of lakes and wetlands supported- 200,890 ha
- Area of floodplain supported- 47,770 ha
- Area of estuary habitat supported- 23,768 ha
Northern Basin
The northern basin received 225 GL of Commonwealth environmental water. Similar to past years, Condamine Balonne received the largest volume as a combination of overbank and fresh flows. The Barwon Darling, Border Rivers, Gwydir, Macquarie, and Warrego Valleys all received water for the environment primarily as fresh flows and base flows.
Southern Basin
The Southern Basin received the bulk of the deliveries. Central Murray, Lower Murray and the Murrumbidgee Valleys received the largest deliveries.
Timing of Commonwealth environmental water delivery (2023-24)
In the northern Basin, 255 GL of Commonwealth environmental water was delivered in two distinct pulses: summer (53% of release) and winter (22% of release). The spring and autumn releases were smaller at 10% and 15% respectively (table 3.5).
In the southern Basin, 2,616 GL of Commonwealth environmental water was delivered. The largest release was in spring (58% of release) followed by summer (21%), autumn (12%) and winter (9%).
Table 3.5 Seasonality of Commonwealth environmental water releases in the northern and southern Basins, 2022–23
Table 3.5 Seasonality of Commonwealth environmental water releases, 2023–24.
Water years: 2014–24
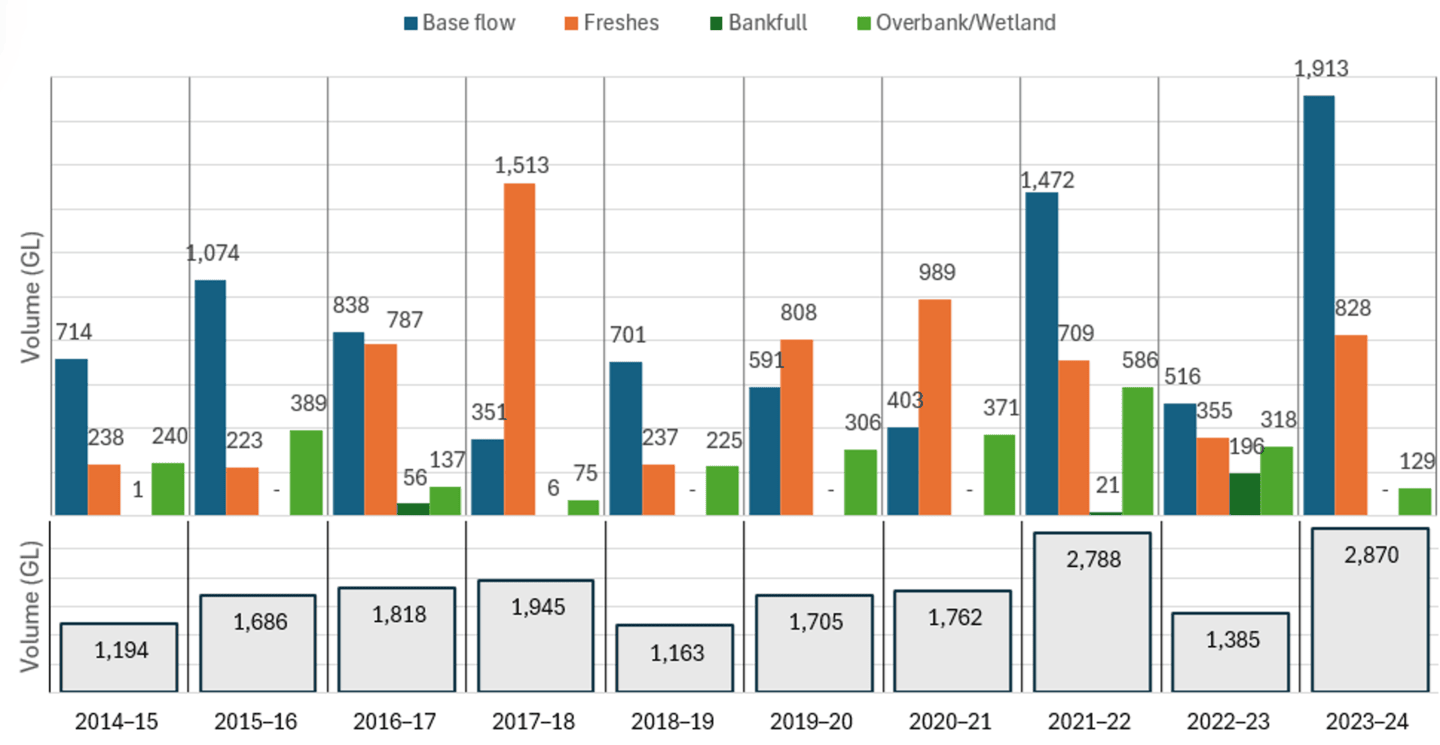
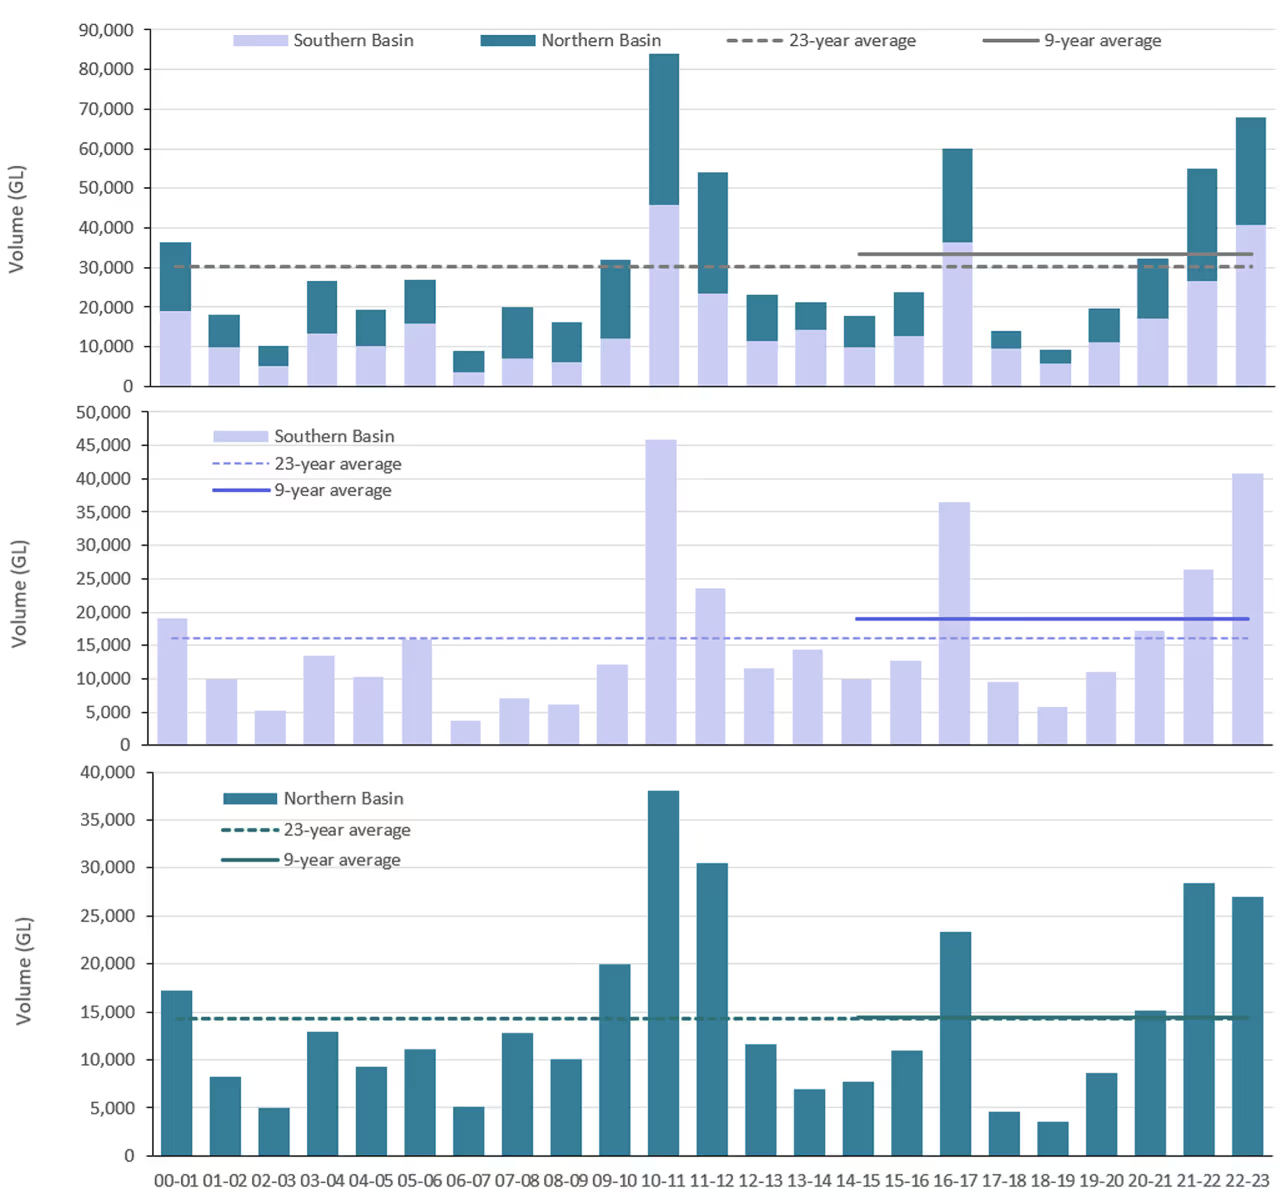
Over the ten years, from 2014 to 2024, a total of 18,310 GL of Commonwealth environmental water was delivered across 1,194 independent watering actions. Instream actions delivered larger volumes than wetland actions (Figure 3.5). The 2023-24 water year had the highest allocation in the volumes of Commonwealth environmental water delivered compared with recent years.
The southern Basin valleys received most of the Commonwealth environmental water by volume and watering actions (Figure 3.7). In the northern Basin valleys, the Condamine Balonne Valley received the highest volume of environmental flows over the 10 years, mainly through one massive fresh/overbank action (Figure 3.7).

Timing of Commonwealth Environmental Water Delivery (2014–24)
Across the 10 years, Commonwealth environmental water was generally delivered with a similar seasonal pattern to 2023-24. In the southern Basin, most Commonwealth environmental water was released in spring and summer pulses, even in drier years (water years 2017–20).
In the northern Basin, releases were spread across the whole water year. Large releases were prevalent in a winter-spring pulse until the water year 2016–17, after which releases were more prevalent in an autumn pulse.
Approach and Evaluation
The Commonwealth Environmental Water Holder delivers environmental water across the Murray–Darling Basin valleys to improve the hydrological and ecological outcomes for the Basin. The River Flows and Connectivity Theme evaluates the contribution of Commonwealth environmental water to the Basin Plan by addressing the following core question:
What did Commonwealth environmental water contribute towards the restoration of the hydrological flow regime?
Assessments are conducted at the site, valley, and Basin scales. It reports on four features of the flow regime base flow, freshes, lateral connectivity, and longitudinal connectivity.
- Base flows and freshes are estimated using gauging stations in valleys where Commonwealth environmental water has been delivered and where long-term watering plan thresholds for these flow components are available. These flows are compared with pre-development flow. Pre-development flows are modelled flows and connectivity, in a scenario without development (pre-1984), provided by the Murray–Darling Basin Authority (MDBA)
- Lateral connectivity (connectivity between river channel and floodplain) is measured as the total combined areas of floodplain that received Commonwealth environmental water.
- Longitudinal connectivity (connectivity between hydrologically connected valleys) is evaluated as increases in end-of-valley flows, length of waterways connected and frequency of inundation of watercourses
All of these are compared with the objectives and expected outcomes established in the Basin Plan and the Basin-wide environmental watering strategy (the Strategy). This evaluation is limited to Commonwealth environmental water; environmental water held by other holders is not evaluated and is out of scope (pg. iii). The River Flows and Connectivity theme has sufficient data to model and compare environmental outcomes, both with and without Commonwealth environmental water (counterfactual modelling).
Objectives and Expected Outcomes
The Strategy (MDBA 2019) sets out expected environmental outcomes to improve connections along rivers and between rivers and their floodplains (pg.1). These are listed in Table 1.1.
Table 1.1 – River flows and connectivity expected environmental outcomes to be achieved beyond 2019 as set out in the Strategy. Only discharge based objectives are evaluated by the Basin-scale team; however, the Strategy (MDBA 2019) also includes a salinity objective for the Coorong, and objectives for the openness of the Murray mouth.
- 30% more into the River Murray
- 30–40% more to the Murray Mouth (and it open to the sea 90% of the time)
- By 10–20% in remaining catchments
To address the overarching evaluation question and evaluate whether the Strategy objectives are progressing or have been achieved, we reformulated the Strategy objectives as questions to make our interpretation of the objectives explicit (pg.3). The questions include:
Limitations of Basin-Scale Evaluation
There are important limitations to consider in interpreting the Basin-scale evaluation:
- Data sources and methods vary between jurisdictions. The disaggregation of Commonwealth environmental water from daily observed flows is carried out by different agencies, each using its own methodology.
- Inconsistent threshold availability. Attribution of flow components to the hydrological regime relies on thresholds defined in long-term watering plans. However, many valleys lack thresholds at all gauges, resulting in issues with consistency and comparability (pg.3).
What have we learned
Water Year 2023-24
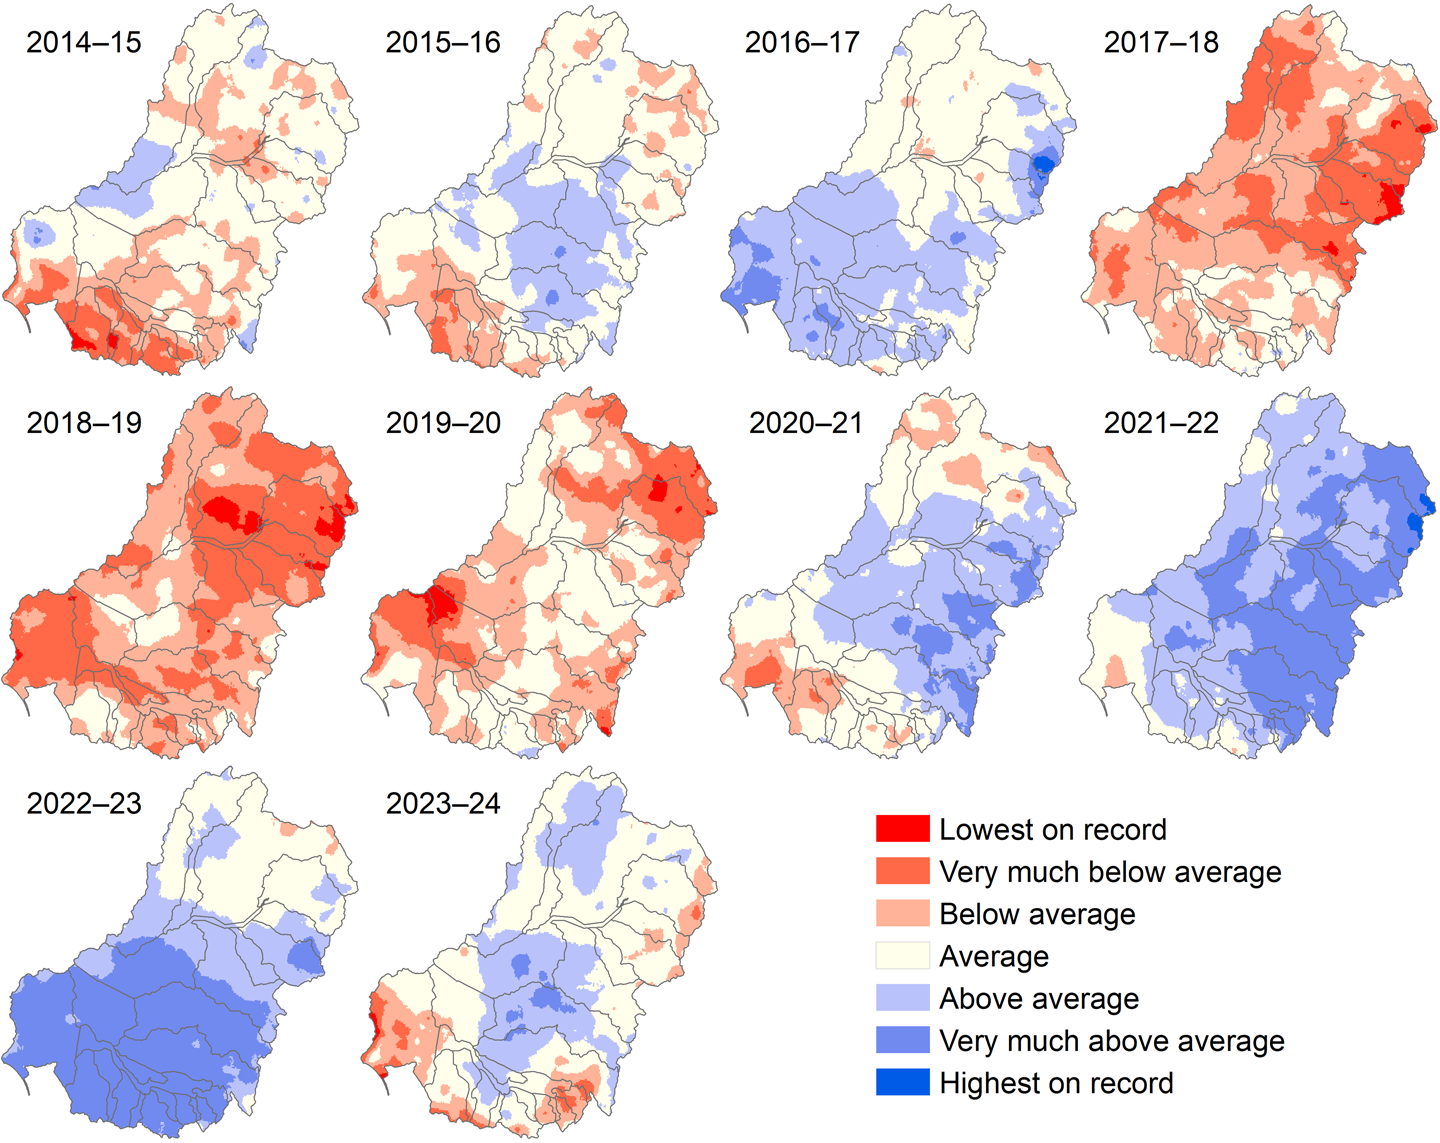
Average precipitation conditions were observed across the Basin, noting that slightly wetter than average conditions were observed in central NSW, while drier-than-average conditions were observed in the head fringes of the Basin in Victoria, Lower Murray and the head of valleys in the northern Basin. The key findings for 2023–24 water year include:
- Surface water runoff and inflows into storages were much smaller than previous years and were more comparable to 2019–20, possibly due to the below-average rainfall in the heads of the valleys which feed the storages.
- The volume of Commonwealth environmental water delivery in 2023–24 was the highest over the ten-year period. This is likely due from storages being relatively full from previous wet years.
- Commonwealth environmental water was delivered over the entire water year with most volume delivered in spring and autumn.
- Most Commonwealth environmental water was delivered as base flow actions in the southern Basin. There was one high-volume base flow action in the northern Basin. Where base flow actions were delivered, they improved the flow regime by progressing the hydrograph closer to either the medium of pre-development flows or by moving the hydrograph into the 10th to 90th percentile of pre-development flows.
- Actions to delivery freshes were delivered in most valleys and substantially contributed to the increased duration of freshes.
- Commonwealth environmental water contributed substantially to lateral and longitudinal connectivity due to prolonged delivery timeframes and actions targeting important wetland assets. This includes:
- 23,768 ha of estuary
- 200,890 ha of lakes and wetlands
- 47,770 ha of floodplains
Water Year 2014-24
Over the 10-year monitoring program, 18,310 GL of Commonwealth environmental water was delivered over 1,194 watering actions for a wide range of hydrological and ecological purposes. Some key findings include:
- Flows over the last 10 years have been close to or slightly above the longer-term (24-year) average in the northern and southern Basins, mostly due to 3 of the 5 wettest years occurring in the last 10 years.
- Over the 10 years, Commonwealth environmental water has contributed flows to a maximum length in any one year of 22,164km (2021–22).
- Recent wetter years have generally shown higher connectivity with Commonwealth environmental water (in conjunction with other flows) leading to greater achievement of environmental outcomes. The total length of waterways connected was highest in the Murrumbidgee and Central Murray system. Even in wetter years, Commonwealth environmental water extended the duration of flows in some periods.
- Commonwealth environmental water was often delivered in partnership with state and other environmental water holders. Of the 1,194 watering action, about 50% were in collaboration with partners and other flows, and Commonwealth environmental water contributed about 50% of the partnered watering actions.
- Cumulatively over the 10-year monitoring period, 446,264 ha of wetlands, lakes and floodplains received Commonwealth environmental water.
Informing adaptive management
In conclusion, the average to slightly below average rainfall conditions in 2023–24 translated to the volume of water delivered for the environment being greater than in any other year during the 10-year monitoring period. The number of actions was lower than in 2021–22, though the total volume was similar. The large number of base flow actions shows real-time adaptive management in practice, where a drier summer prompted baseflow deliveries to maintain connectivity.
Inundation watering actions were delivered to increase the duration of the natural floods to maximise ecological outcomes. Where available, comparison with the pre-development flow regime shows that Commonwealth environmental water deliveries progressed the current year’s regime towards a proposed natural regime. In the same way that adaptive management evolves and improves water delivery in the Basin, the hydrological evaluation will evolve in future years to improve the nuanced understanding of what Commonwealth environmental water contributes to the hydrological regime in the Basin.
Evaluation coverage (area)
This evaluation uses the map of 25 major river valleys that were developed for the Long Term Intervention Monitoring, which were derived from the Sustainable Rivers Audit catchment boundaries. Evaluation is undertaken for the 19 valleys in which the Commonwealth holds water entitlements
Hydrological outputs are synthesised at the Basin scale and, when pertinent, are presented in relation to the northern Basin and southern Basin, as well as at valley scale. Climatic conditions are provided to set context for the watering actions for the water year (pg.4).
Contextual data
Each year, the River Flows and Connectivity evaluation considers rainfall, climate and in-flow data as context for the evaluation.
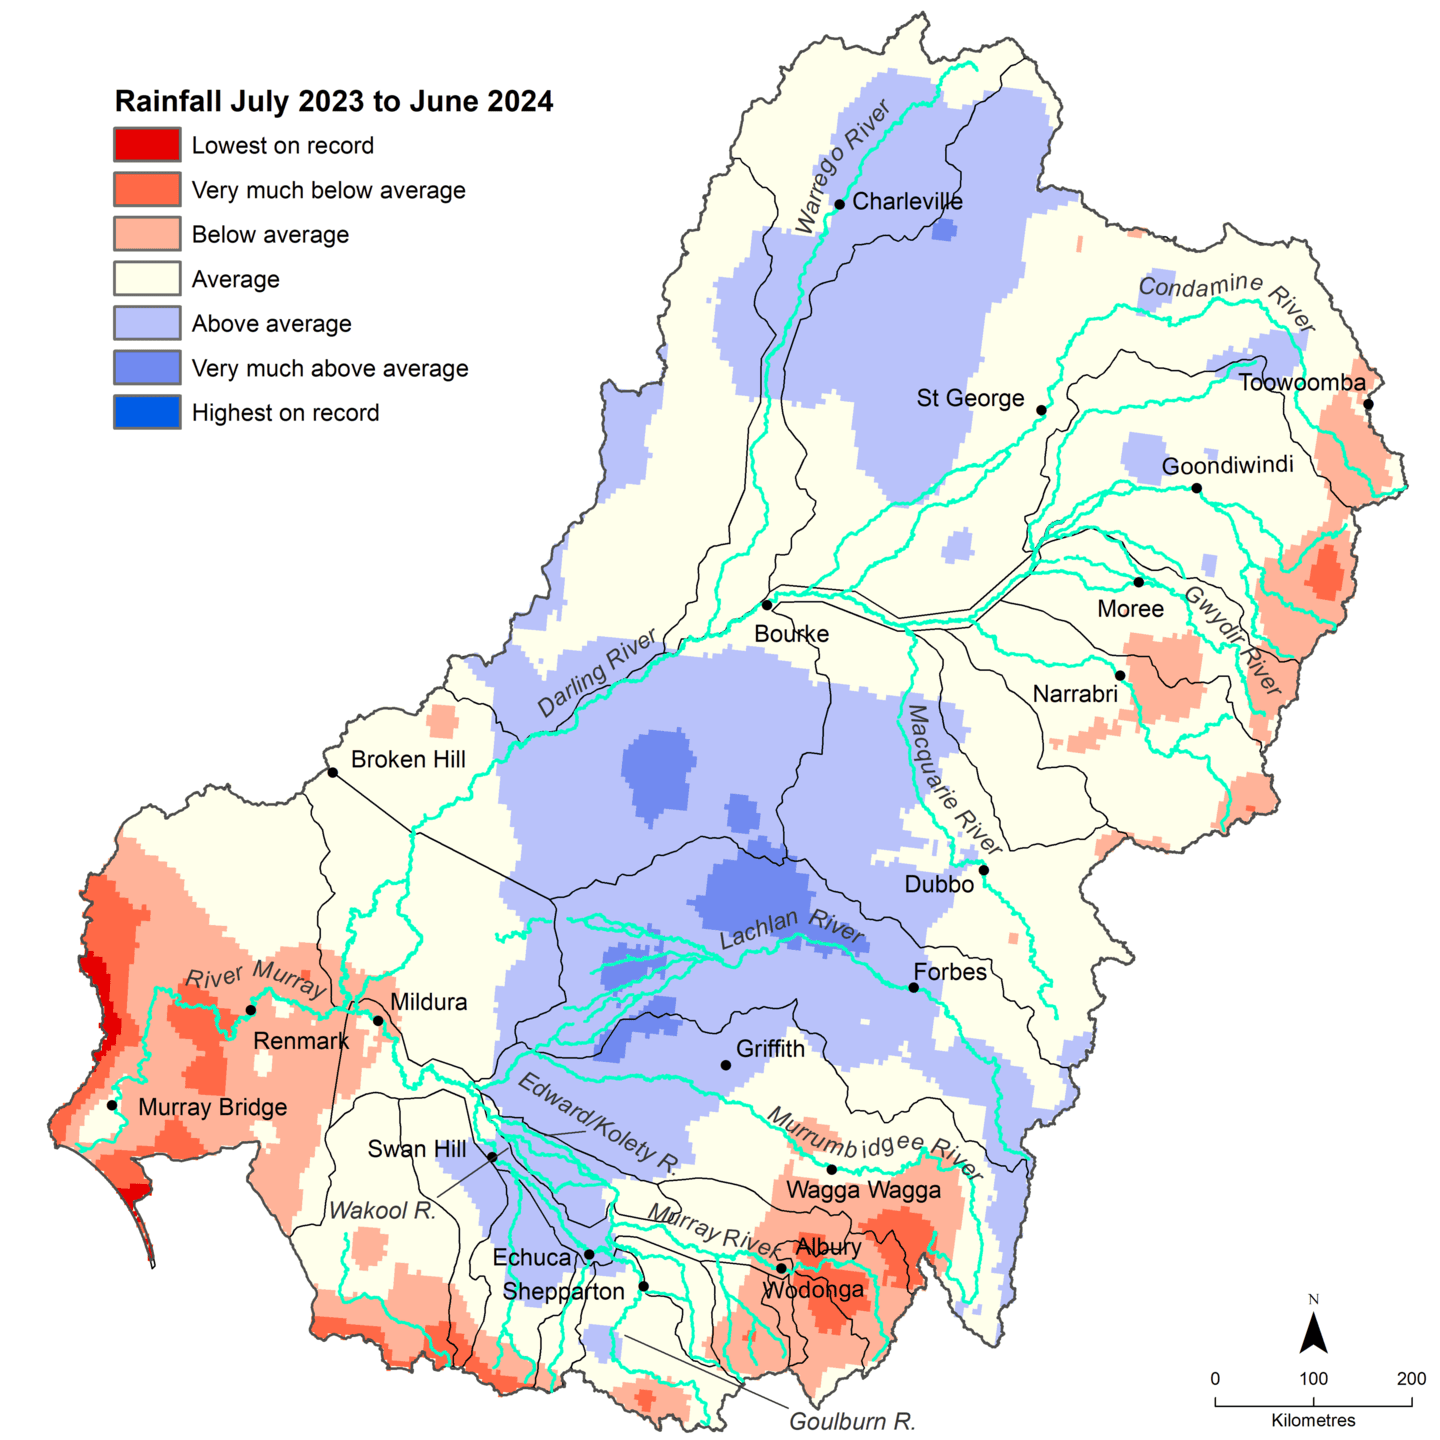
Rainfall
In the 2023-24 water year, the average rainfall across the Basin was 479.9mm. Much of the southern and northern parts of the Basin received average rainfall, while large parts of central NSW and Victoria experienced above-average to very much above average rainfall. Parts of the Basin in South Australia, upper Murray catchment and north-east NSW experienced below-average rainfall.
Inflows to the system
In the 2023-24 water year, the average rainfall across the Basin was 479.9mm. Much of the southern and northern parts of the Basin received average rainfall, while large parts of central NSW and Victoria experienced above-average to very much above average rainfall. Parts of the Basin in South Australia, upper Murray catchment and north-east NSW experienced below-average rainfall.
Surface water runoff
Total runoff in the Basin in 2023–24 was 22,509 GL, which is smaller than the 10 and 24 year average. The rainfall conditions resulted in one-third less than average surface flows across the Basin. The whole of Basin storages started at 94% on 5 July 2023 and remained at 95% during spring. However, storage fell to 77% in winter 2024, indicating that most of the available water flowed into the Basin in the first half of the year.
Meeting the Basin Plan Environmental Objectives
We measure the contribution of Commonwealth environmental water to meeting the Basin Plan objectives for water-dependent ecosystems using the targets as set out in Schedule 7, with regard to ecologically relevant targets set out in the valley Long Term Watering Plans prepared by state agencies and climatic conditions. The evaluation of Commonwealth environmental water contribution to meeting Basin Plan objectives are as set out in the Approach section of the report.
Flow Regime
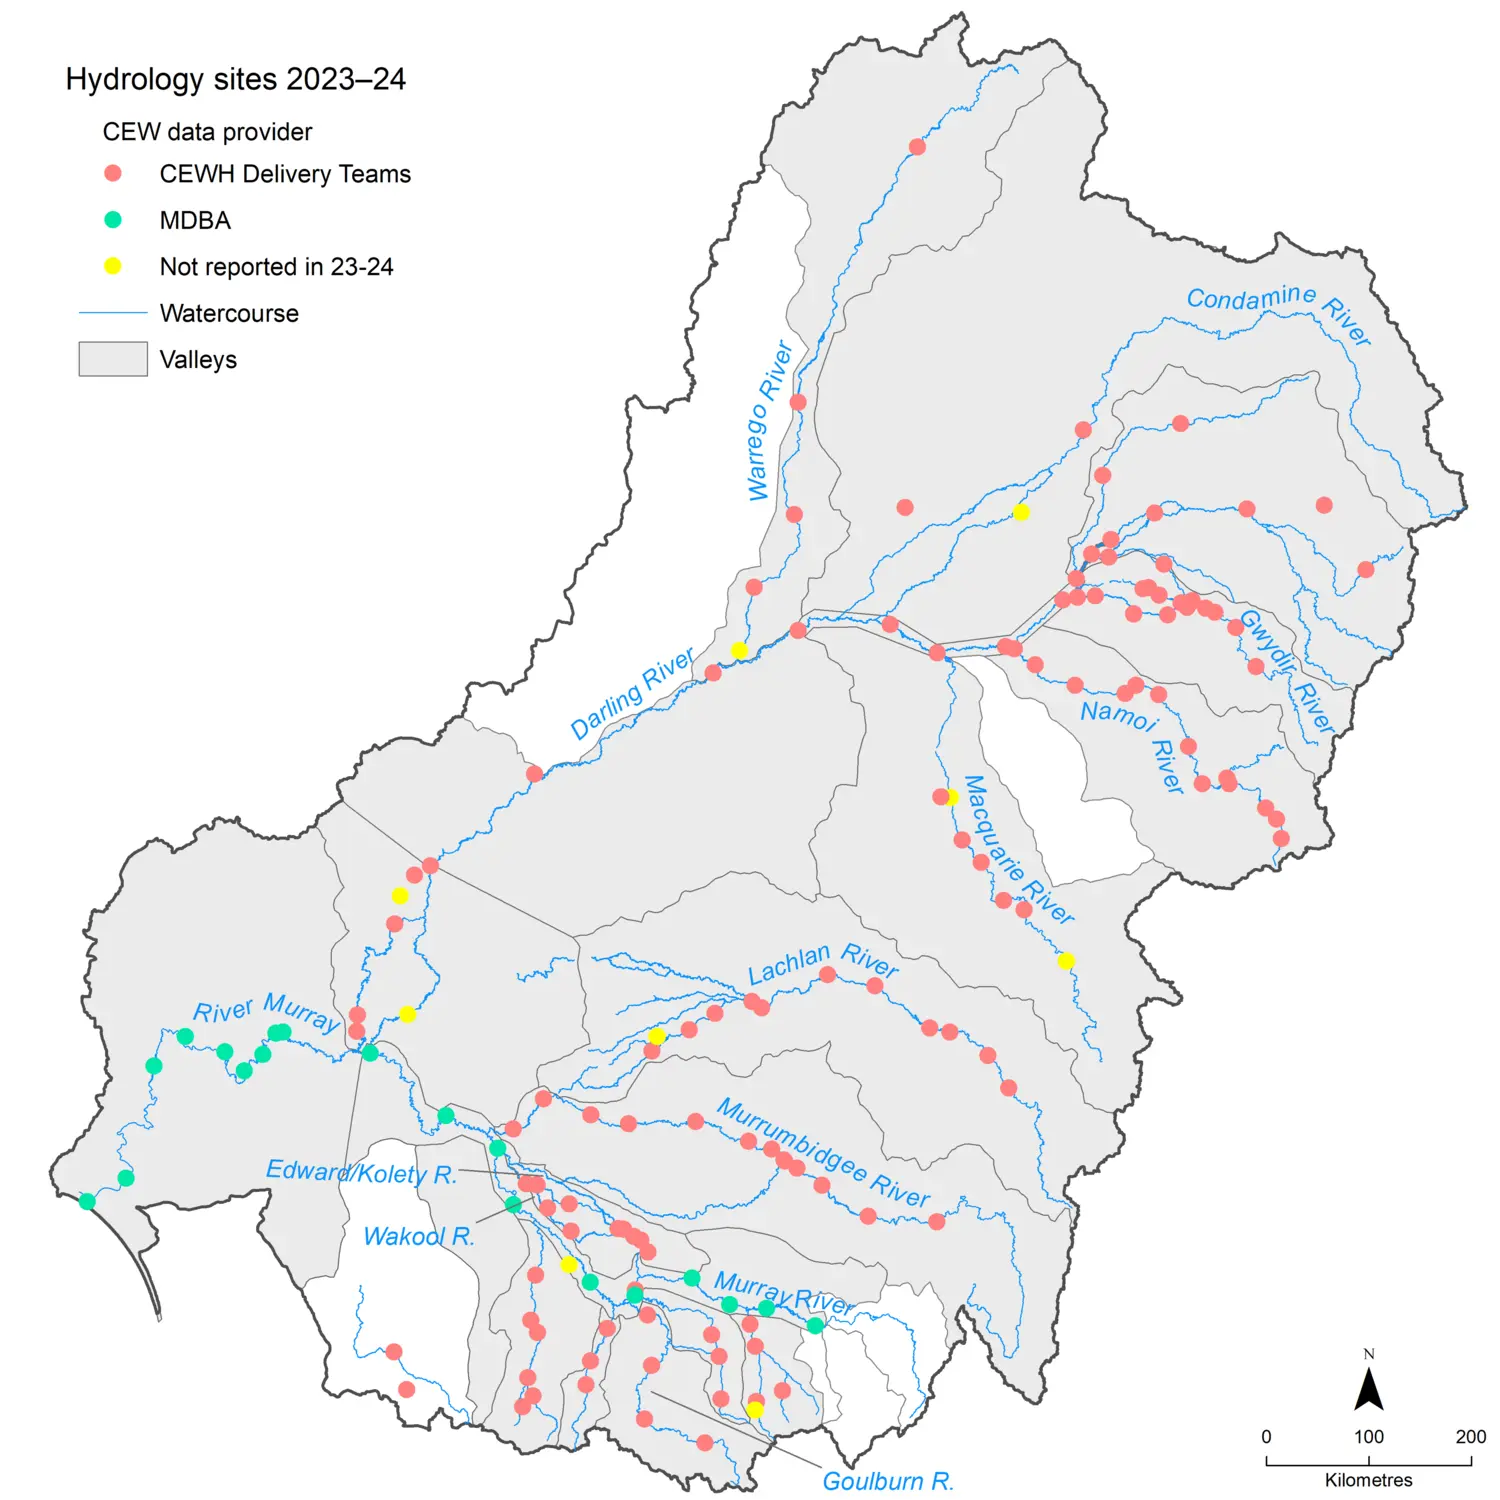
The report shows the contribution of Commonwealth environmental water at key evaluation points associated with environmental assets within the Basin. These 23 evaluation locations are shown in Figure 4.1.
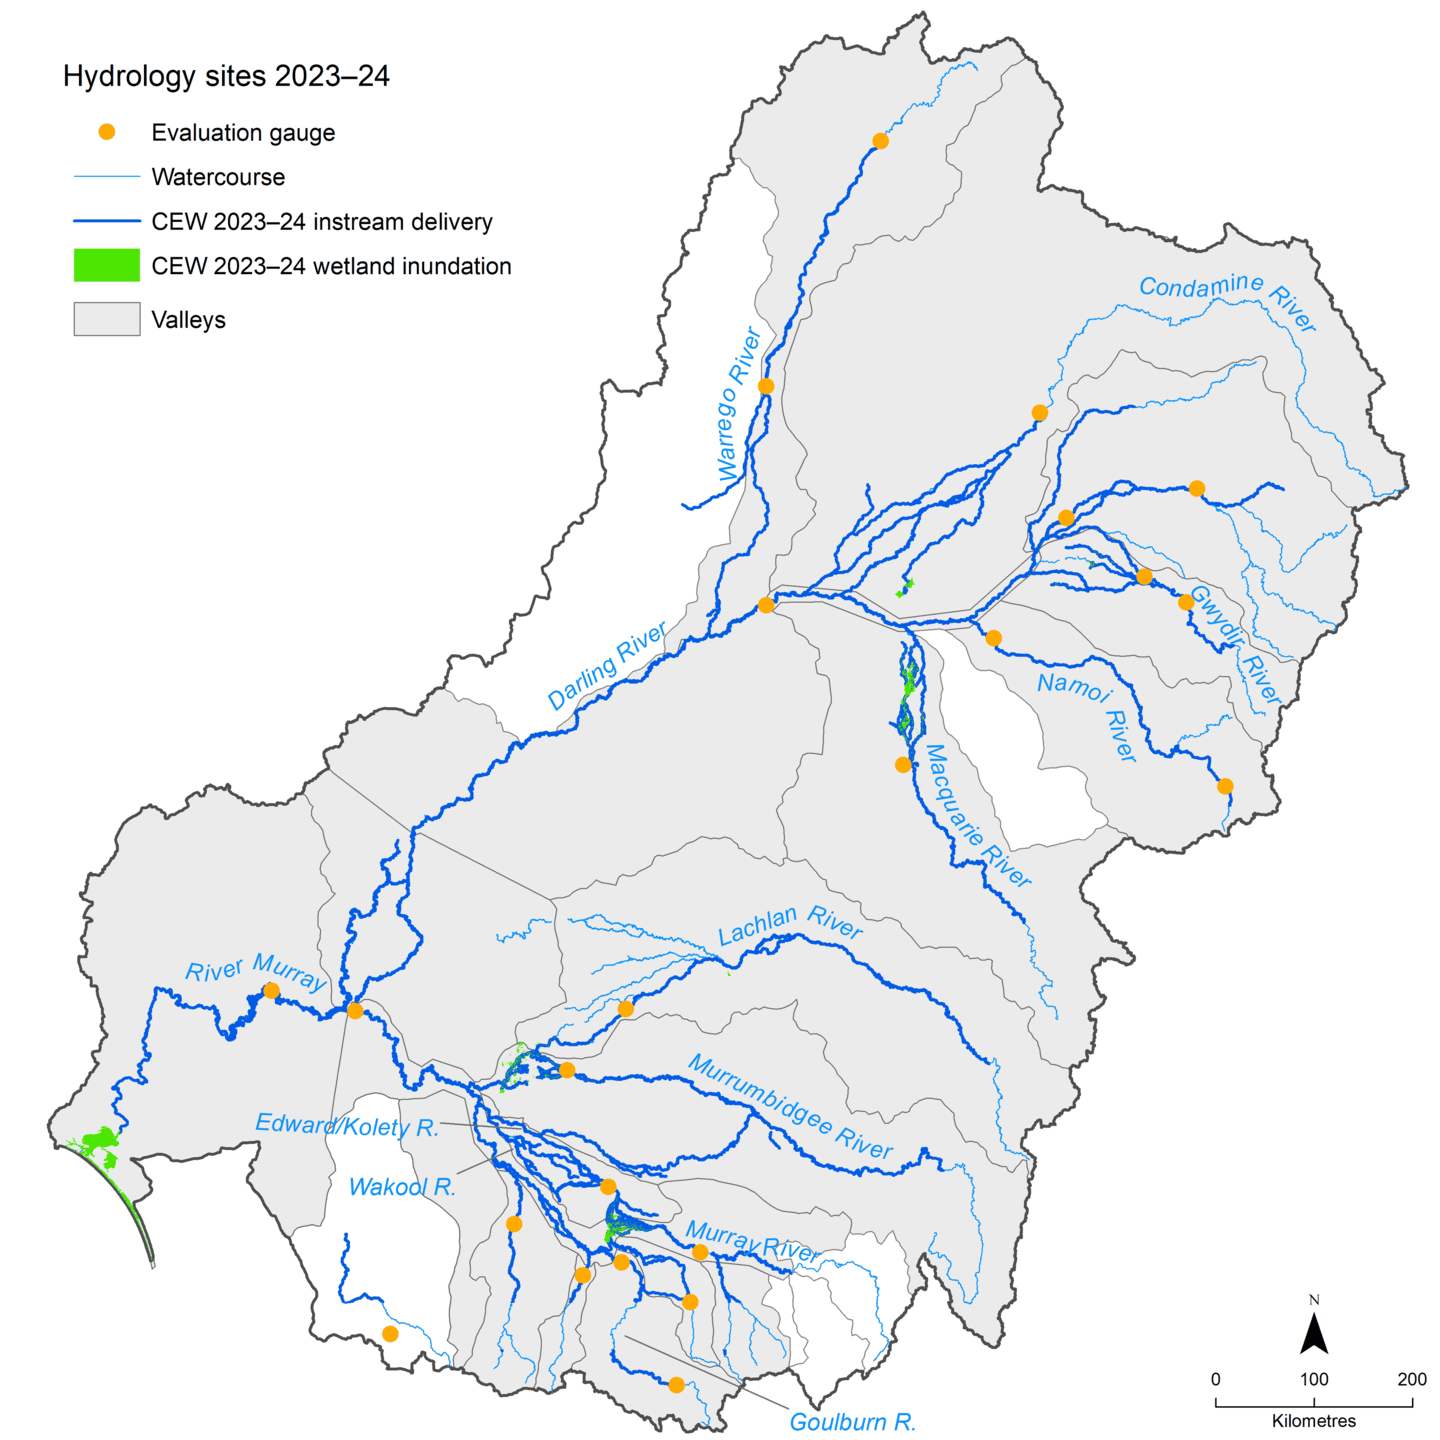
See the full report to see the contribution of Commonwealth environmental water to environmental water deliveries to key assets within the Basin.
Evaluation of flow regime, base flows, freshes, connectivity
Flow regime
- In the northern Basin, the flow signal in 2023–24 was mostly within the 10th to 90th percentile of modelled pre-development flows and often closely followed the median pre-development flow.
- As for Commonwealth environmental water improving the flow regime and progressing it to natural flows, there were two notable instances in the Gwydir River and the Macquarie River when Commonwealth environmental water improved the flow regime to fall within the 10th to 90th percentile range of pre-development flow.
- Without Commonwealth environmental water, the flow would have been lower than the 1st percentile of flows, and the flow would have significantly departed from the natural flow regime
- In the southern Basin, the flow in 2023–24 also followed the pre-development flow closely.
- However, more deviations from the natural flow regime were noted in the southern Basin compared to the northern Basin. Notably, the Victorian valleys (Loddon, Goulburn, Wimmera) saw some flows below the 1st percentile of pre-development flows, but some flows larger than the 99th percentile (high freshes) were noted in most valleys in the southern Basin (Loddon, Campaspe, Goulburn, Murray, Wimmera).
- Commonwealth environmental water played an important role in 2023–24 to progress the flow regime towards the natural flow regime.
Base flows
- In the water year 2023–24, CEW was mostly delivered instream as base flow. Over the 10-year period of the program, the most CEW was delivered in 2023–24. Most of that was in base flow actions (67%).
- Targeted base flow releases led to flow regime improvement and, in some cases, clearly provided progress towards the pre-development flow regime.
Freshes
- All valleys, except for the Barwon Darling and the Lower Darling/ Baaka, received Commonwealth environmental watering actions targeting a fresh component through the water year.
- The average conditions led to flows generally consistent with the natural flow regime in 2023–24.
- Many fresh actions specifically targeted at wetland inundation were delivered to extend the duration of flow above a fresh threshold and, thus, prolong the time the wetlands were inundated, rather than delivering freshes as singular events.
Connectivity
Lateral connectivity
- The watering actions in 2023–24 inundated substantial areas (>1,000ha total) of floodplains and floodplain wetlands in 8 of the 25 valleys of the Basin
- In 2023-24, the largest areas of inundated wetlands and floodplain were from CEW that was delivered to extend the duration of widespread natural flooding and provide cues to support waterbird breeding rookeries
- Cumulatively over the10-year monitoring period, 446,264 ha (including the Coorong, Lower Lakes and Murray Mouth area) of wetlands, lakes and floodplains received contributions of CEW. This includes 124,091 ha of lakes, including the Lower Lakes, 130,574 ha of wetlands and 191,599 ha of floodplains.
Longitudinal connectivity
- Approximately 21,075km of waterways received CEW in 2023–24.
- Recent wetter years had higher connectivity–CEW in conjunction with other flows may have led to a greater outcome. Lowland streams (permanent and temporary), the most common stream type in the Basin, are also the most connected during CEW releases.
- Over 2014–24, the total length of waterways connectivity supported by the CEW was highest in the Murrumbidgee Valley, followed by the Barwon Darling.

Evaluation against the Strategy
Lateral Connectivity
The Strategy’s lateral connectivity outcomes compare the frequency of freshes between the observed and counterfactual scenarios. Many of the fresh watering actions along with overbank and wetland watering actions in 2023–24 were aimed at extending duration rather than frequency (See Section 5.1). Hence, in 2023–24, most of the valleys saw no increase in the frequency of freshes due to Commonwealth environmental water.
For evaluation year 2023–24, average hydrological conditions contributed to the natural occurrence of freshes, and when Commonwealth environmental water was required to achieve the objective, it was generally used to extend duration rather than frequency (often extending one event as in the Macquarie Marshes). Note that this evaluation only considers Commonwealth environmental water, while other environmental water holders also contributed to the flow.
Longitudinal Connectivity
Base flows in 2023–24 were high and maintained for longer extended durations compared to the pre-development scenario. Hence, the Strategy outcome for base flows was met in all valleys except for Wimmera and Broken. The proportion of CEW for achieving this target was not necessarily the major contributor; however, the phrasing of the Strategy objective states to compare the flow duration above the low base flow threshold against the duration above the low base flow threshold in the pre-development scenario.
End of Basin Flows
The end-of-Basin flows in 2023–24 were representative of an average to wet year. Barrage flows were higher than the required 2,000 GL/year, and water levels were higher than 0.4 Australian Height Datum (AHD) for the entire year, which both would have been met even in the counterfactual scenario without the CEW.
The CEW contribution to the barrage flows was 1,146GL over the year. Another requirement is that the minimum over 2 years should be no less than 600 GL/year. This was also achieved–the minimum was 5,185GL in 2023–24 with CEW contribution, and the minimum was 4,039GL/year in 2023–24 without CEW.