River Flows and Connectivity
Over the past nine years, the River Flows and Connectivity Theme has worked to quantify the contribution of Commonwealth environmental water to protecting and restoring these water-dependent ecosystems.
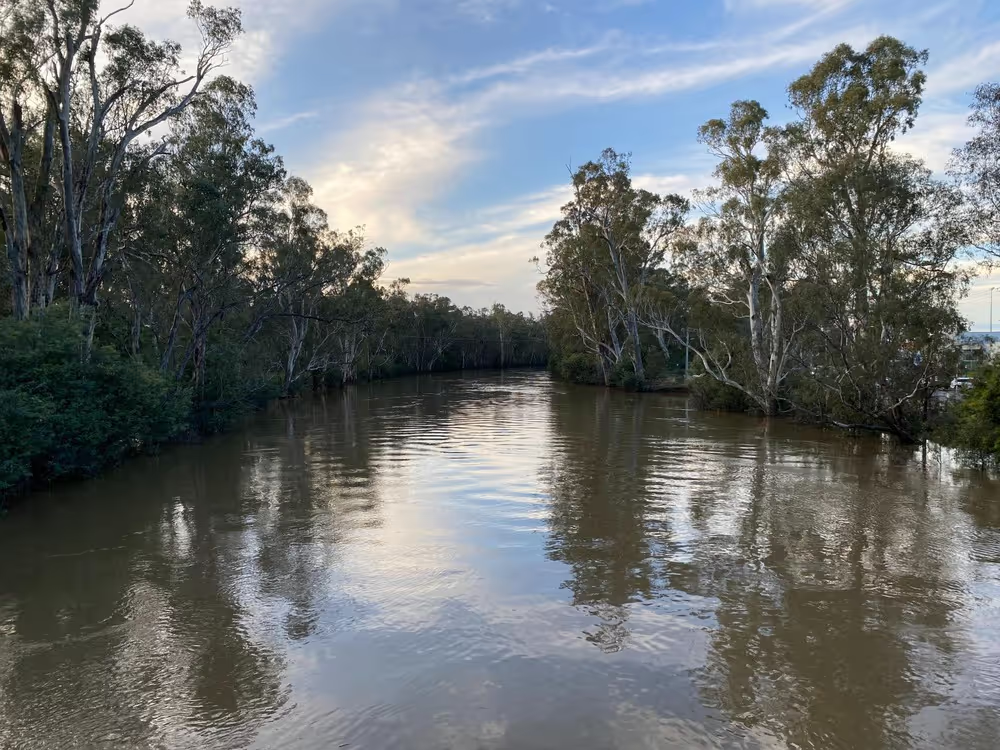
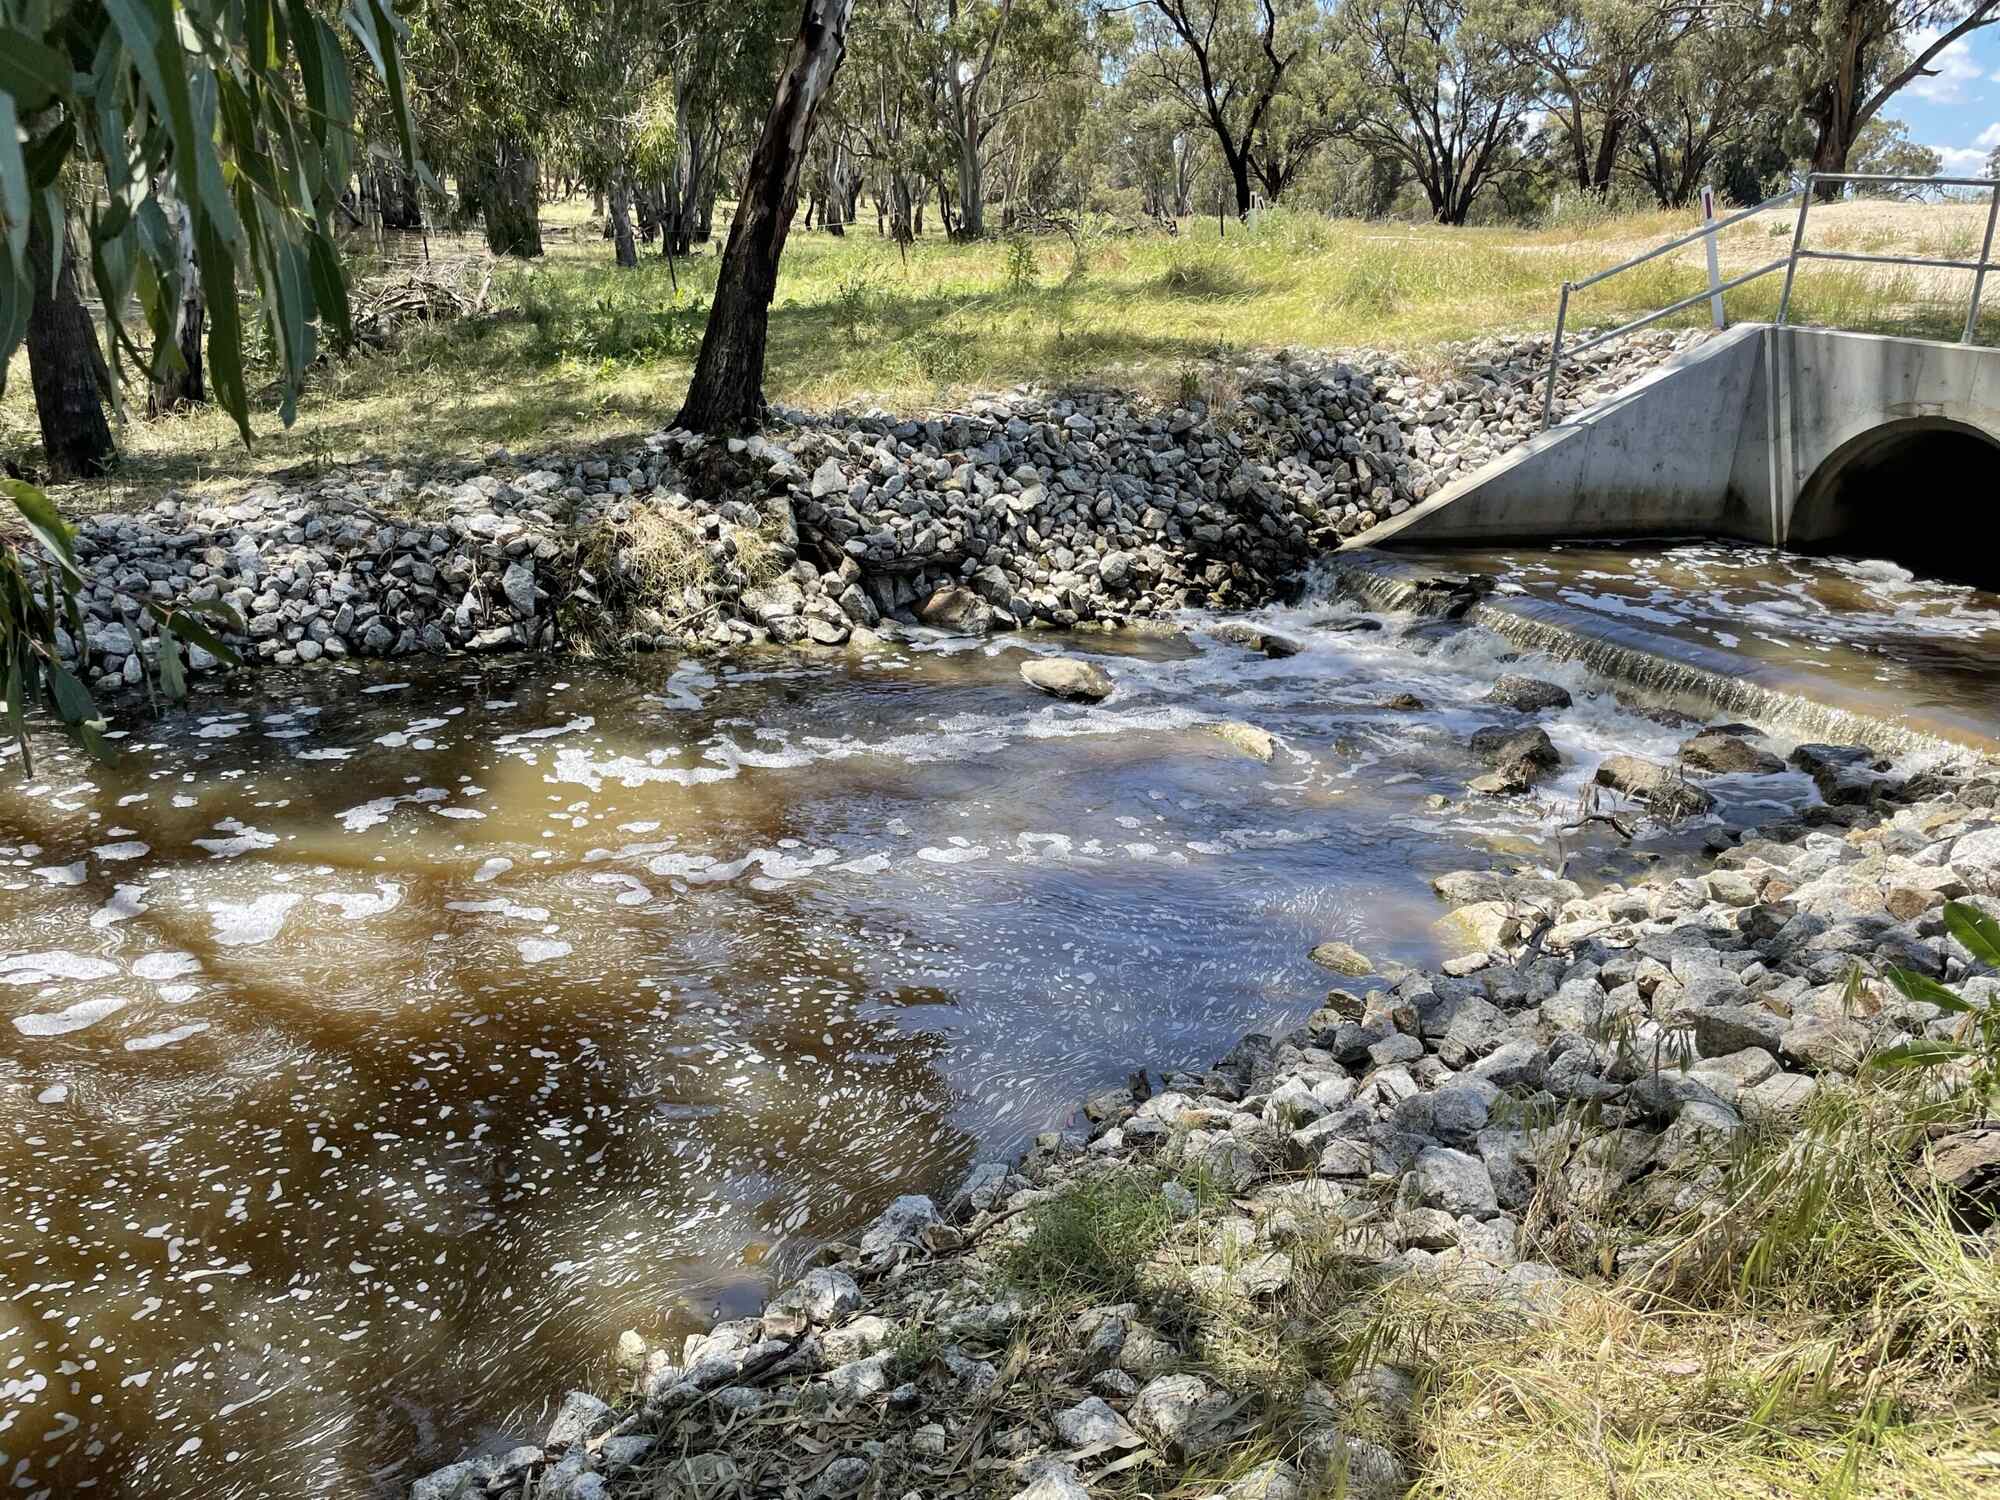
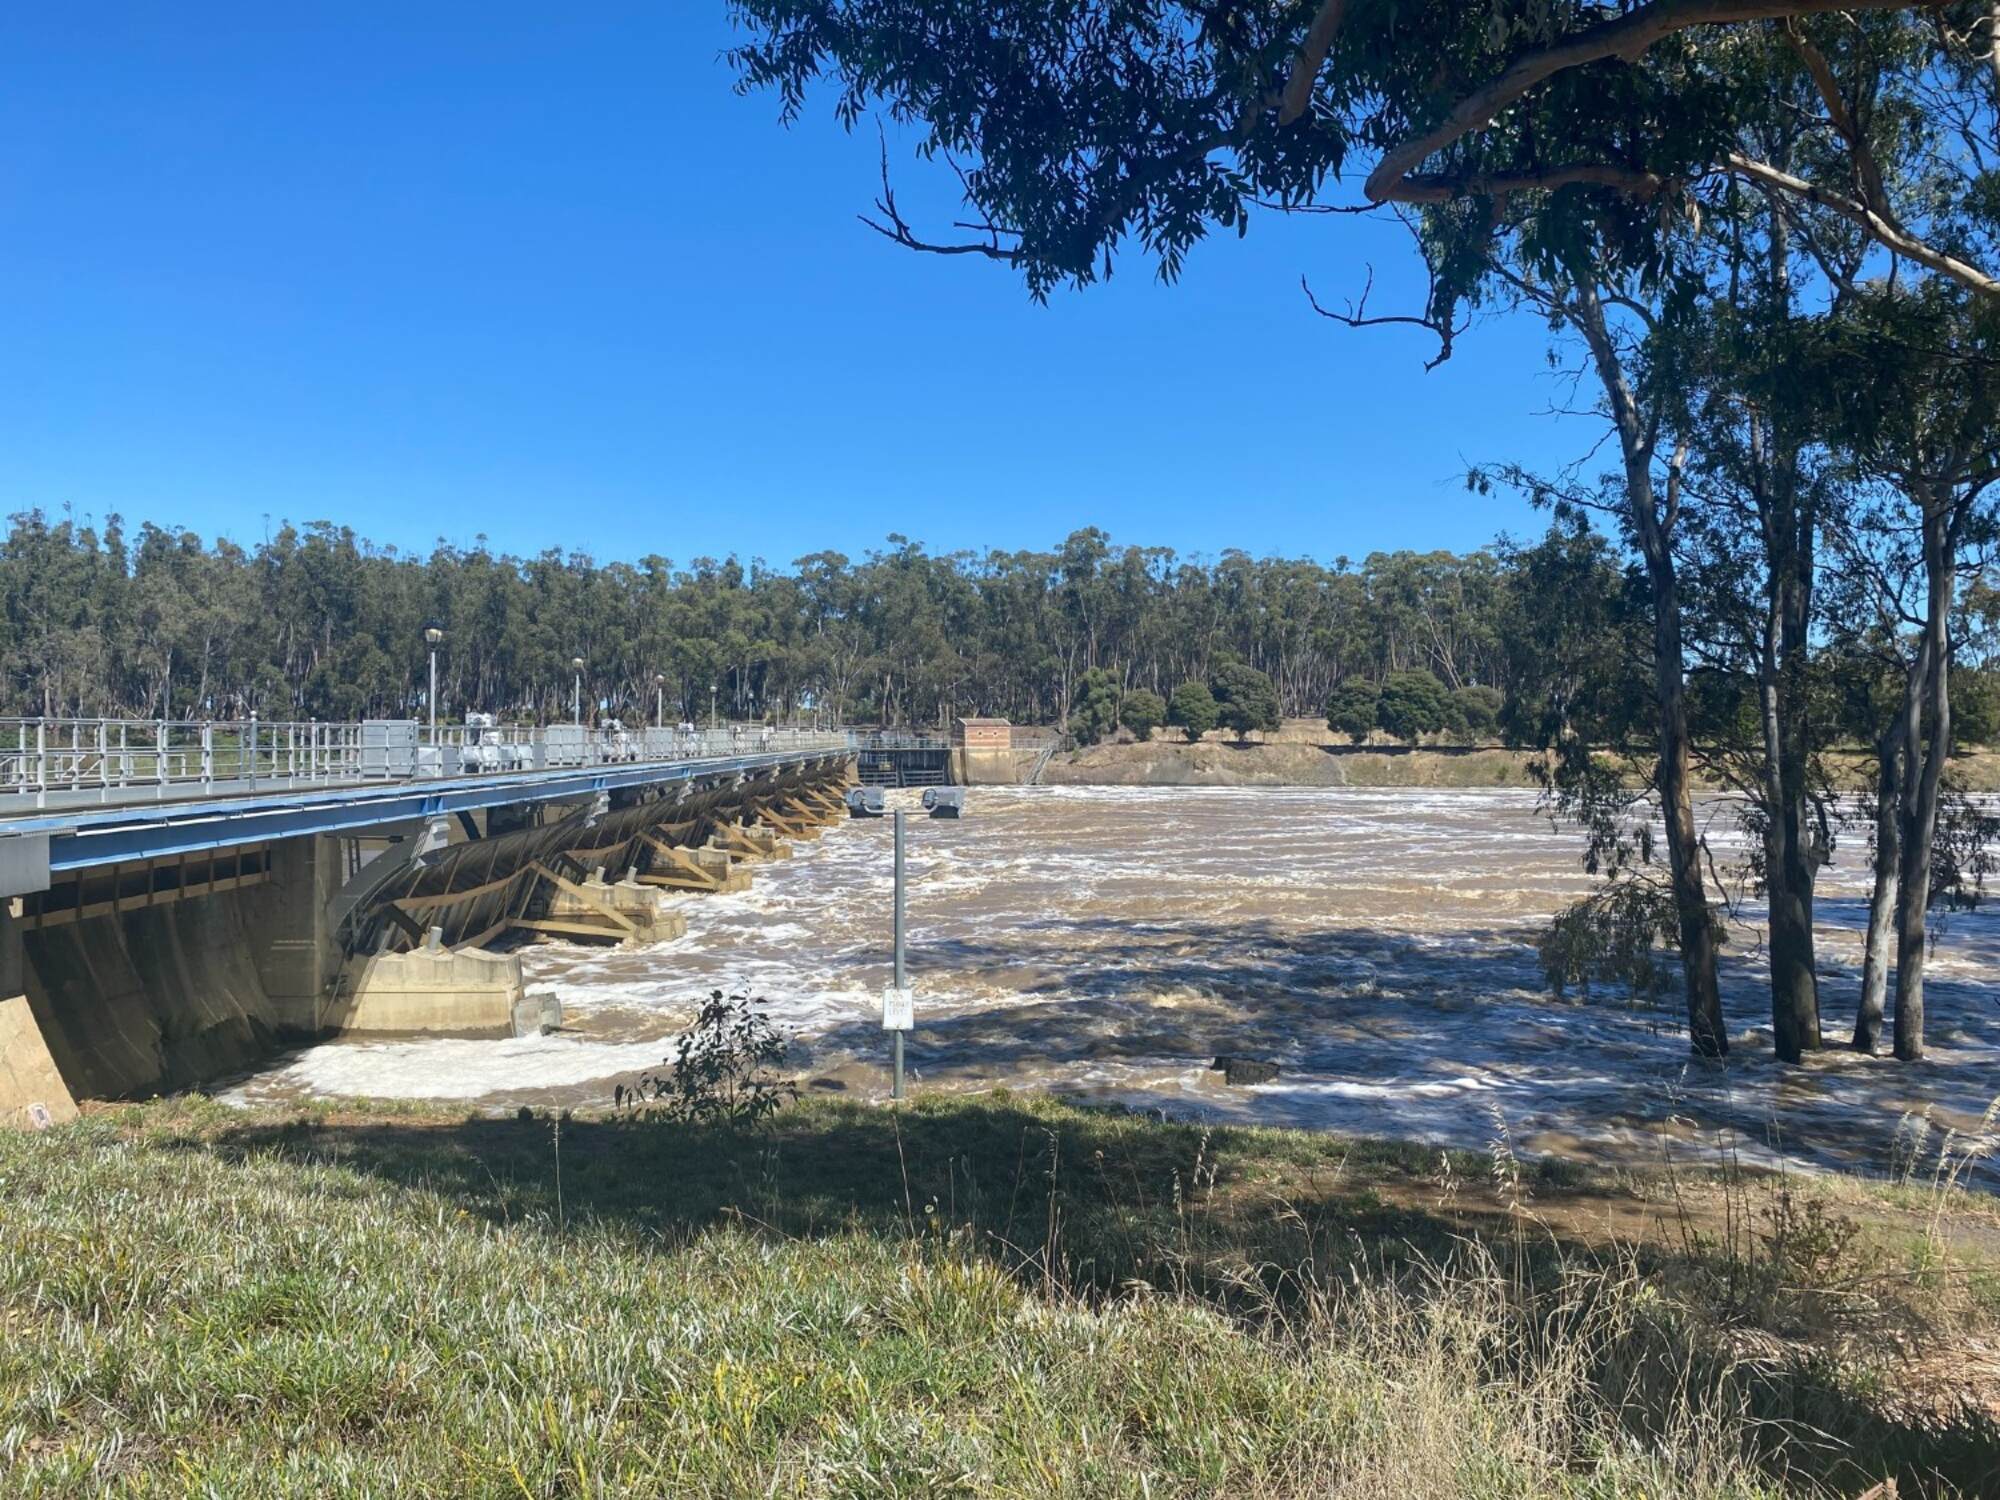
Image: Flooded creek in Yanga National Park, NSW. Photo credit: Tanya Doody
Introduction
Water is the lifeblood of the Murray-Darling Basin, supporting a vast array of biologically rich rivers, lakes, wetlands and floodplain ecosystems – from the headwaters in southern Queensland and the eastern highlands, to the estuary and river mouth in South Australia. In Australia, where river systems are highly variable, understanding river flows and connectivity begins with an understanding of climatic factors such as rainfall patterns, annual weather variability, and runoff. In more regulated systems, like the Murray-Darling Basin, this also includes how water flows are actively managed.
The River Flows and Connectivity Theme assesses how Commonwealth environmental water is contributing to the restoration, improvement, and maintenance of flow regimes, while also enabling vital connections along rivers and between rivers and their floodplains. This theme underpins the evaluation of other ecological Themes, such as Native Vegetation, Waterbirds, and Native Fish, by providing essential context about water movement and availability.
Note: The contents on this page includes summarised text from the following report: 2022-23 Basin-scale evaluation of Commonwealth environmental water: Hydrology. Page number references have been noted throughout the content below for anyone using the full report.

Commonwealth environmental water delivery
The delivery of Commonwealth environmental water is separated into these Watering Actions.
Watering Actions
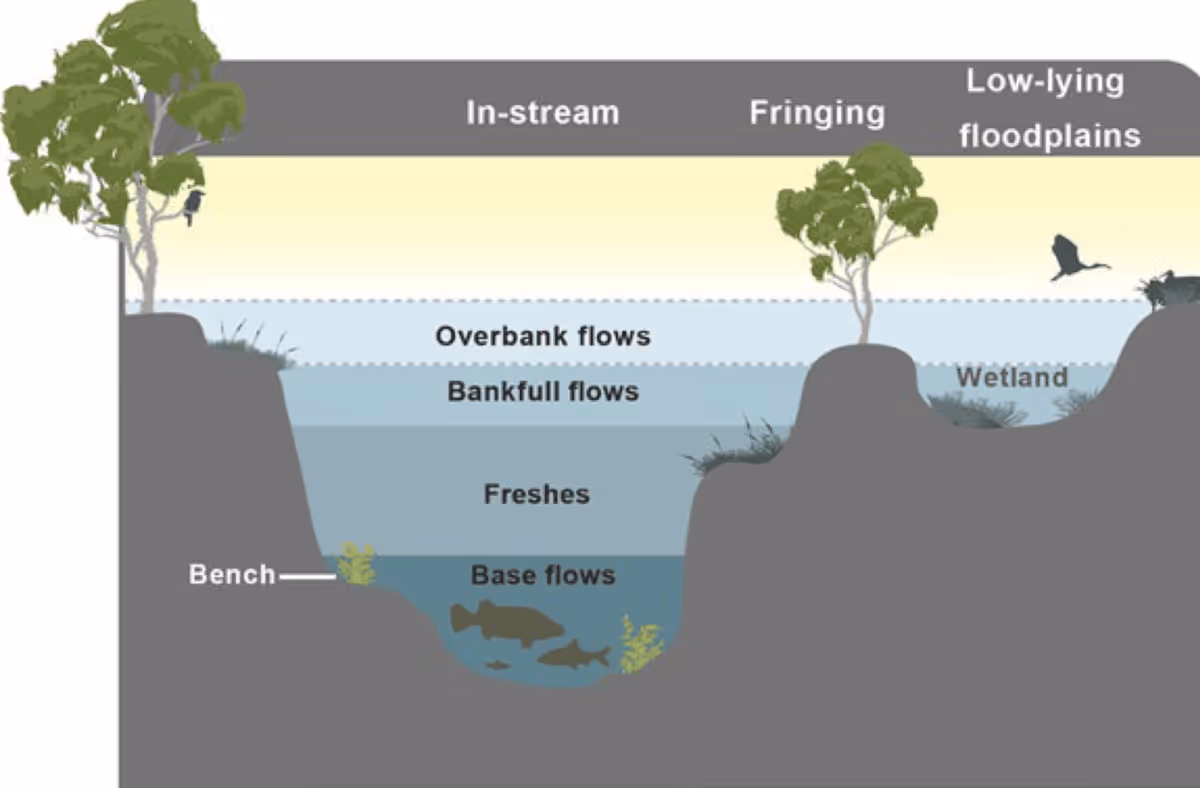
Base flows
Base flows are flows in a system not impacted by runoff, or flows sustained by seeping groundwater.
Freshes
(In-channel) freshes are small-to-medium flow events that fill the river channel
Overbank flows
Low and medium overbank flows are substantial flow events that spill onto the low-level parts of the floodplain, including depressional wetlands. Large overbank flows inundate substantial parts of the floodplain including higher areas.
Wetland watering
Wetland watering actions target specific wetlands with pumped flow rather than natural passing flow that might inundate a wetland naturally.
Expected Outcomes
The above watering actions are used to deliver one or more of these outcomes.
Water year: 2022–23
Total Water Delivery
In the 2022–23 water year, 1,385 GL of Commonwealth environmental water was used through 102 separate watering actions. Of these actions, 61 (61% of volume) supported in-stream flows, 22 (15% of volume) supported wetlands and overbank flows, and 19 (24% of volume) supported a combination of in-stream and overbank flows (pg.13).
Northern Basin
In the northern Basin, 189 GL of Commonwealth environmental water was delivered, with the Condamine–Balonne Valley receiving the largest share of 113 GL (60% of the northern Basin total). It was delivered through two large and three small watering actions, mainly aimed at overbank and fresh flows.
Other valleys in the northern Basin that received environmental water included the Barwon–Darling, Border Rivers, Gwydir, Macquarie, and Warrego. In most cases, water was delivered through licences held in each valley. The Barwon–Darling focused mainly on base flows, while the Warrego had a mix of base flow, fresh, and bankfull actions (pg.13).
Southern Basin
The southern Basin received most of the water in 2022–23, with 1,196 GL delivered. The largest volumes went to the Edward/Kolety–Wakool, Murrumbidgee, and Lower Murray valleys (pg.13).
Timing of Commonwealth environmental water delivery (2022–23)
In the northern Basin, 189 GL of Commonwealth environmental water was delivered in 2 distinct pulses: spring (50% of release) and winter (23% of release). The summer and autumn releases were smaller at 11% and 16%, respectively. The largest pulse started in September in the Condamine–Balonne Valley, where 84 GL were delivered to the Narran Lakes system.
In the southern Basin, 1,196 GL of Commonwealth environmental water was delivered. It was delivered with a peak in summer (39% of releases); releases in autumn, spring and winter were similar at 17%, 21% and 23%, respectively (pg.18).
Table 3.5 Seasonality of Commonwealth environmental water releases in the northern and southern Basins, 2022–23
Water years: 2014–23
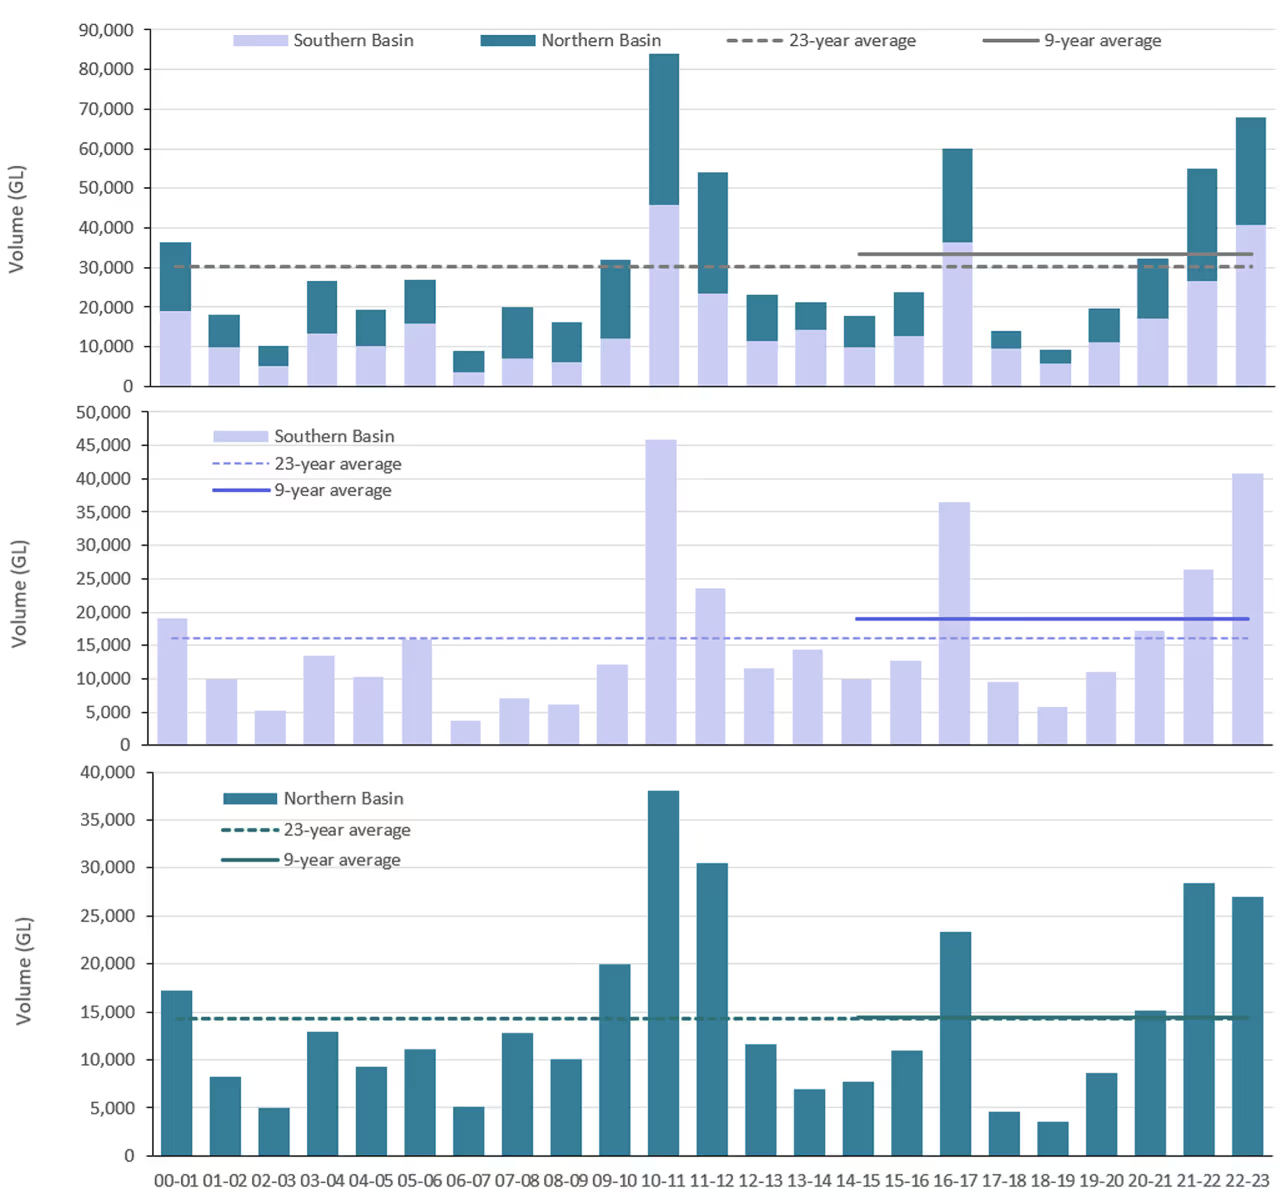
Between 2014 and 2023, the Commonwealth Environmental Water Holder (CEWH)delivered 1,081 independent watering actions, accounting for 15,443 GL of environmental water across the Murray–Darling Basin (Figure 3.5). These actions supported a wide range of hydrological and ecological outcomes (pg.16).
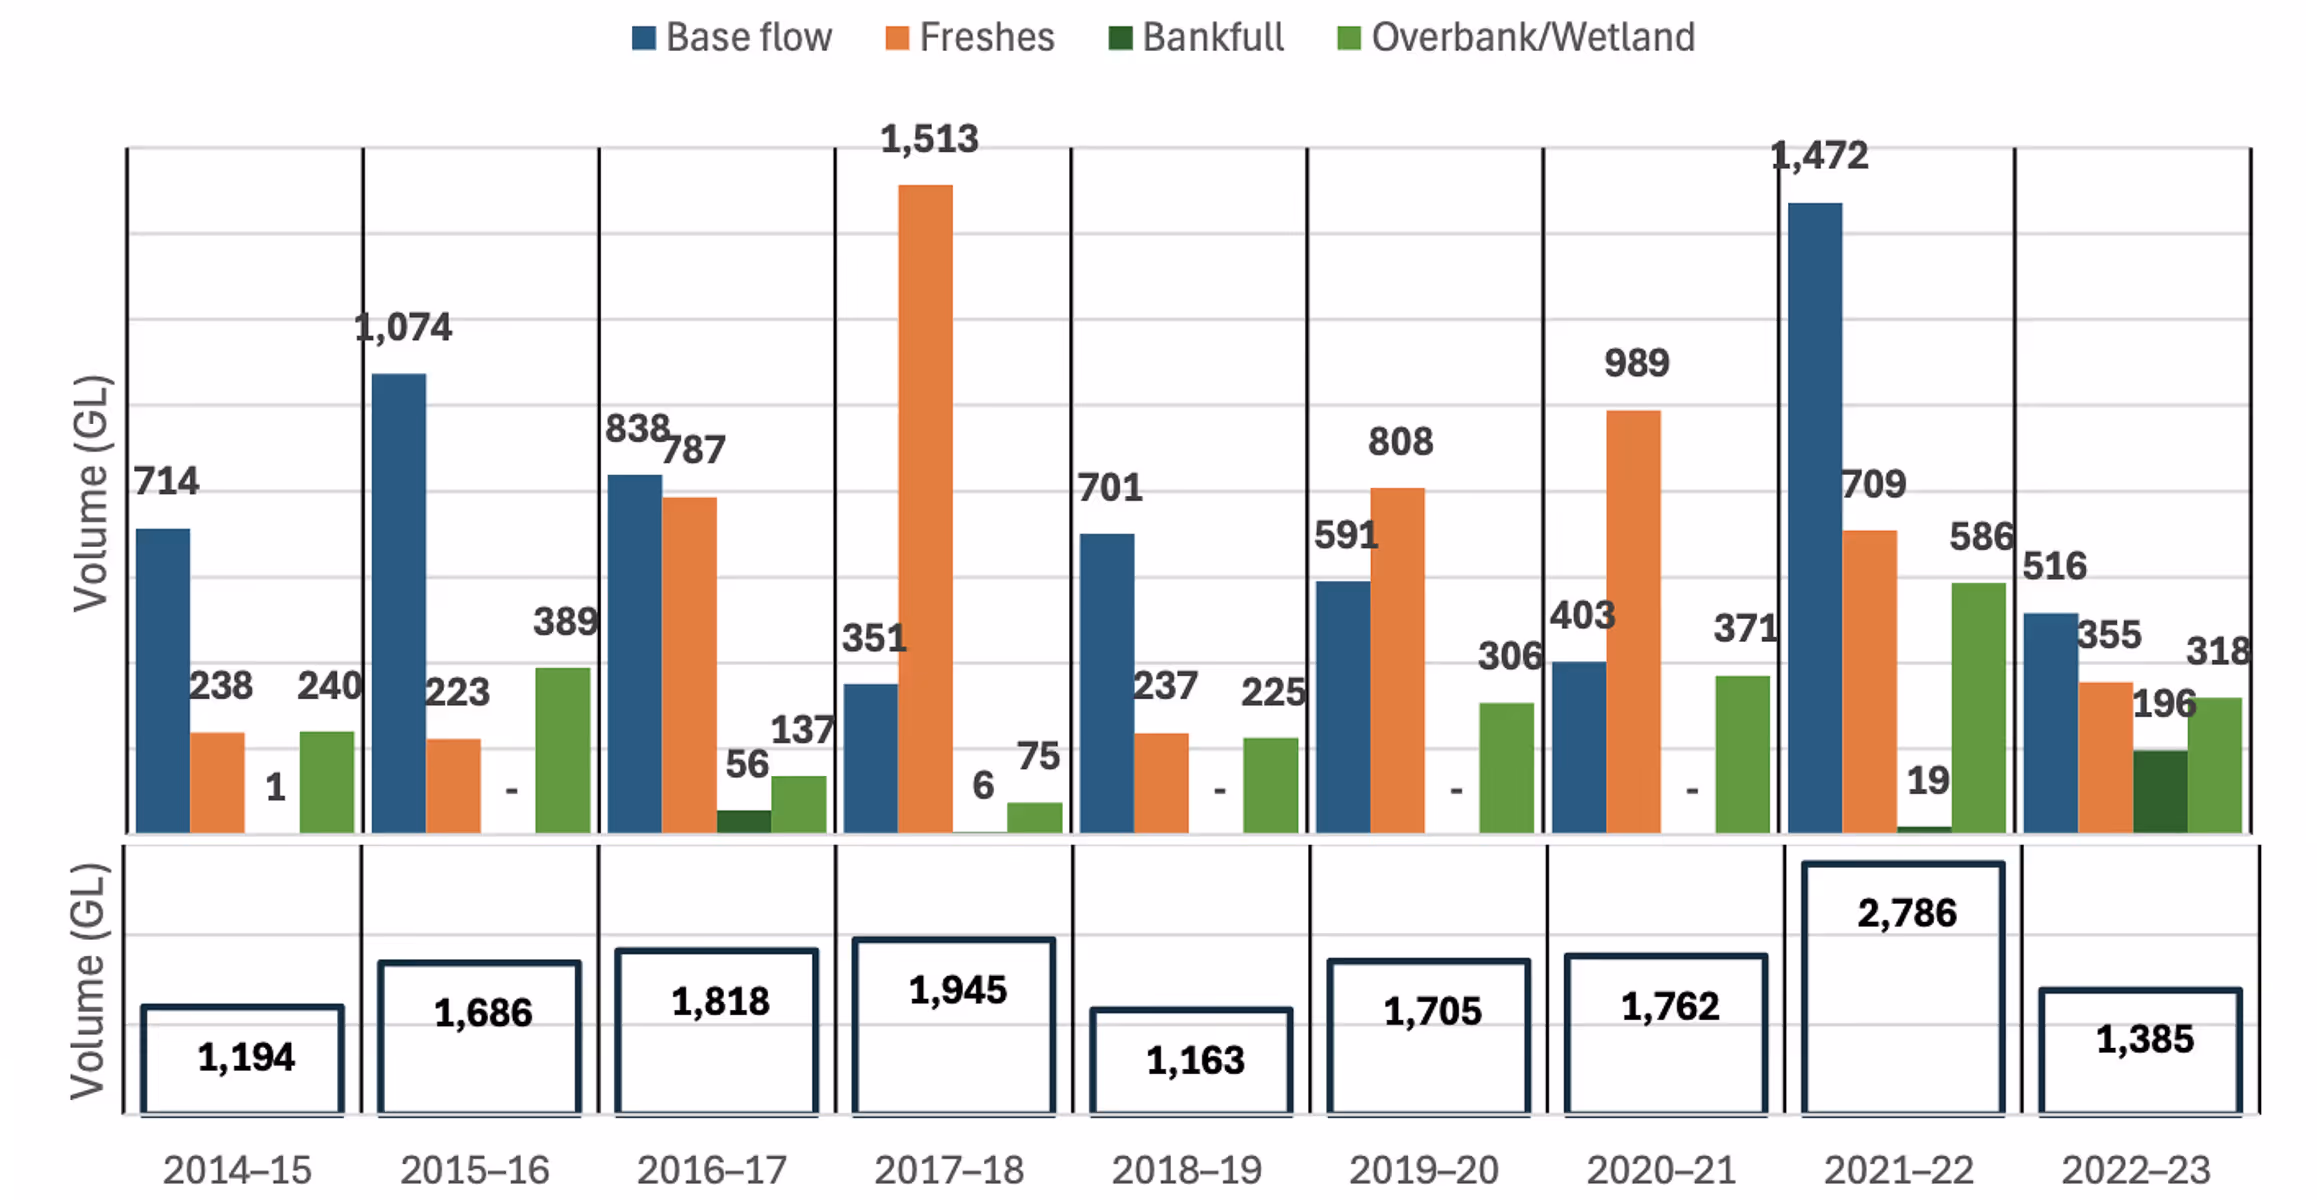
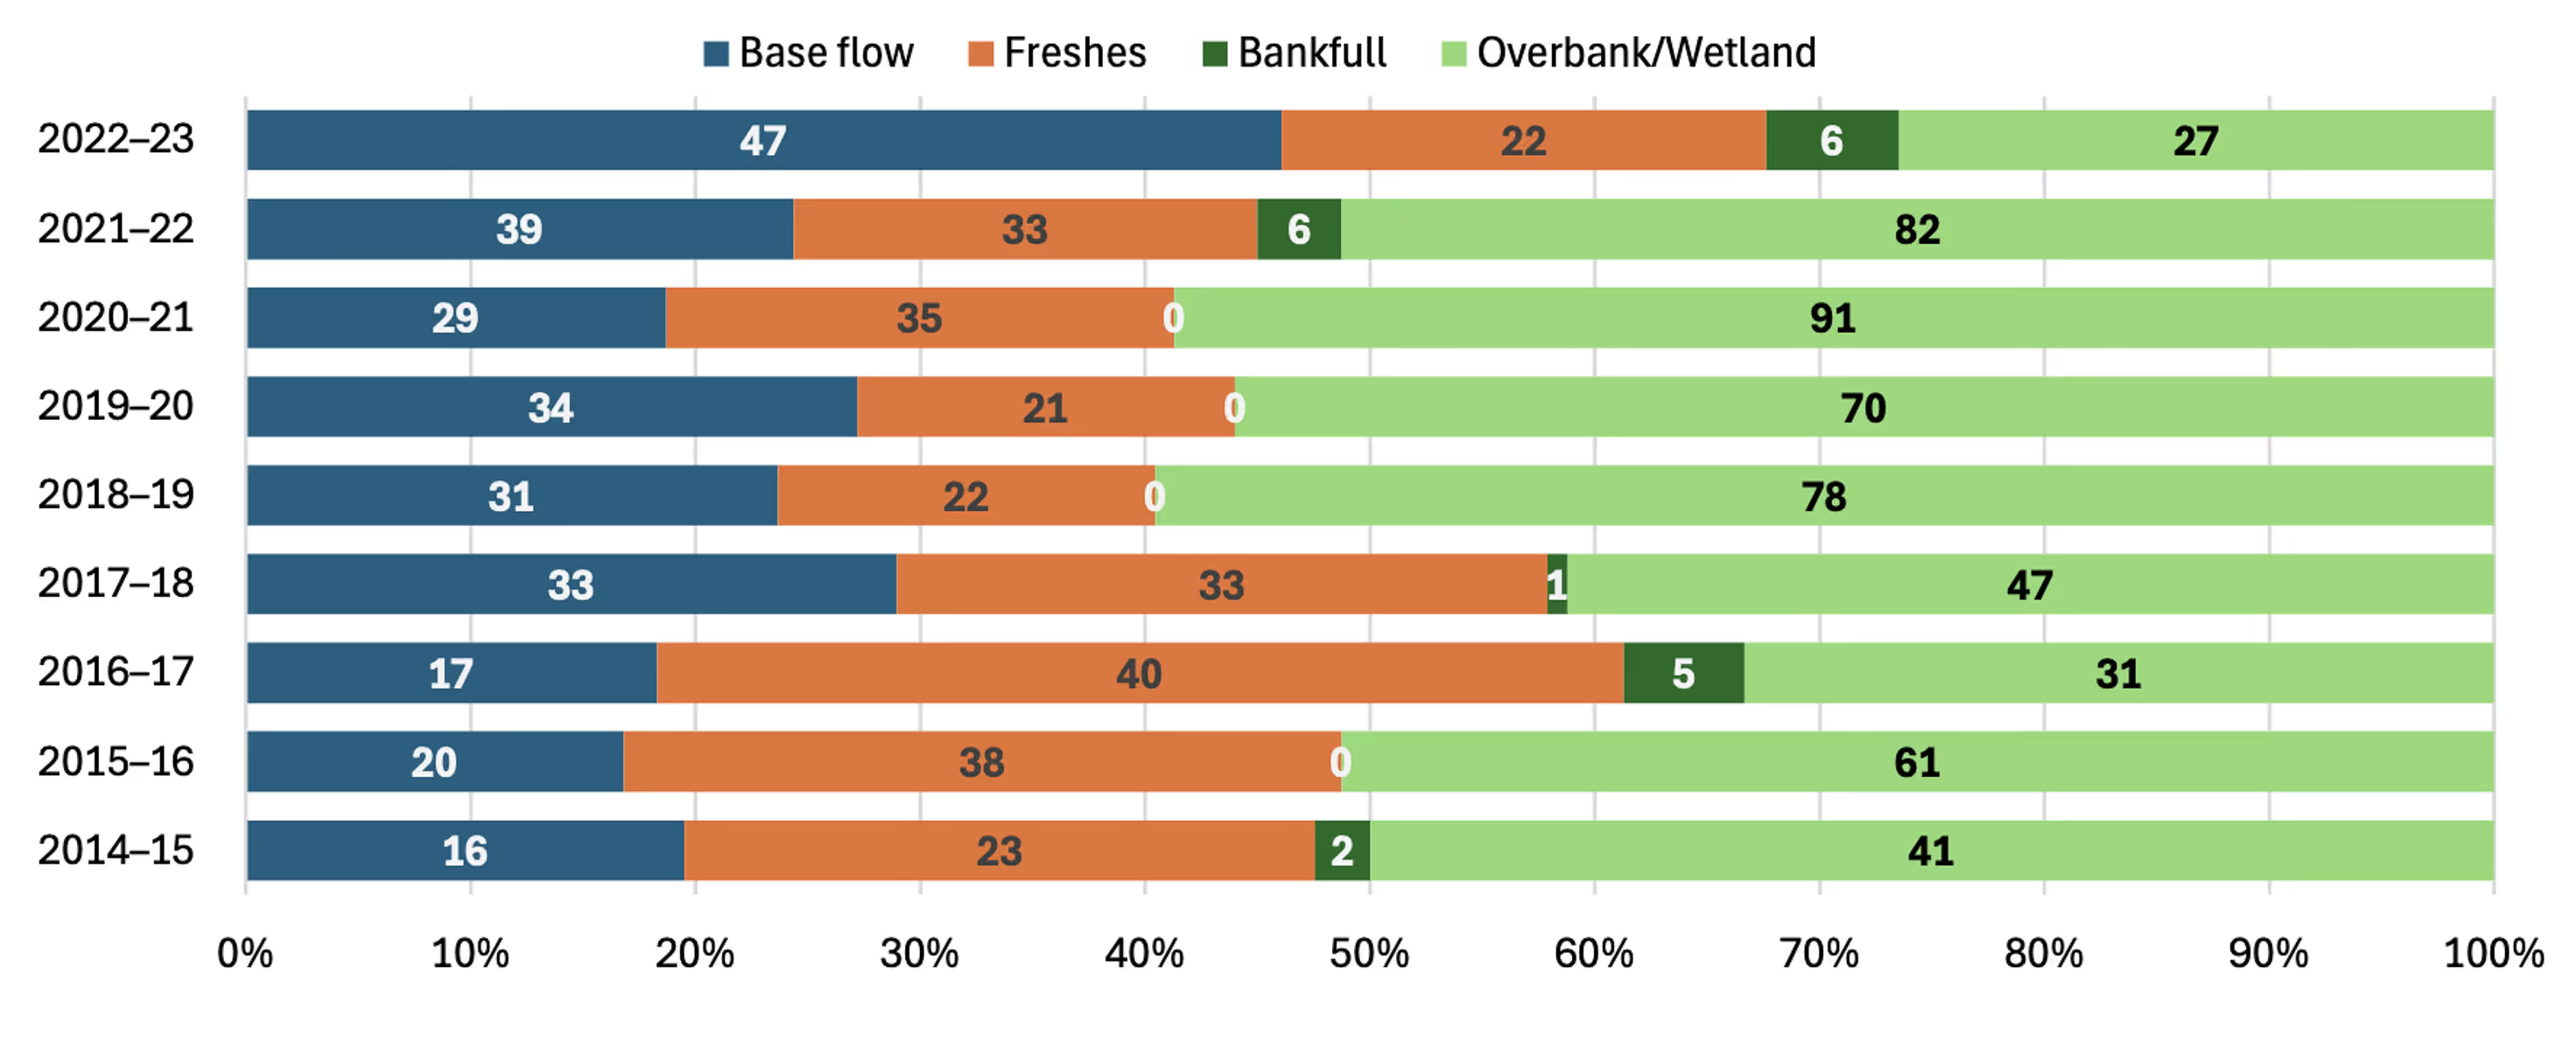
Over the 9 years, wetland-focused actions were the most common, making up 46% of all watering actions. However, this pattern shifted in certain years. In 2016–17, most actions targeted freshes, while in 2022–23, base flows became the primary focus (Figure 3.6). Notably, the volume of water delivered in 2022–23 was lower than in recent years, due to already extremely wet conditions reducing the need for additional watering.
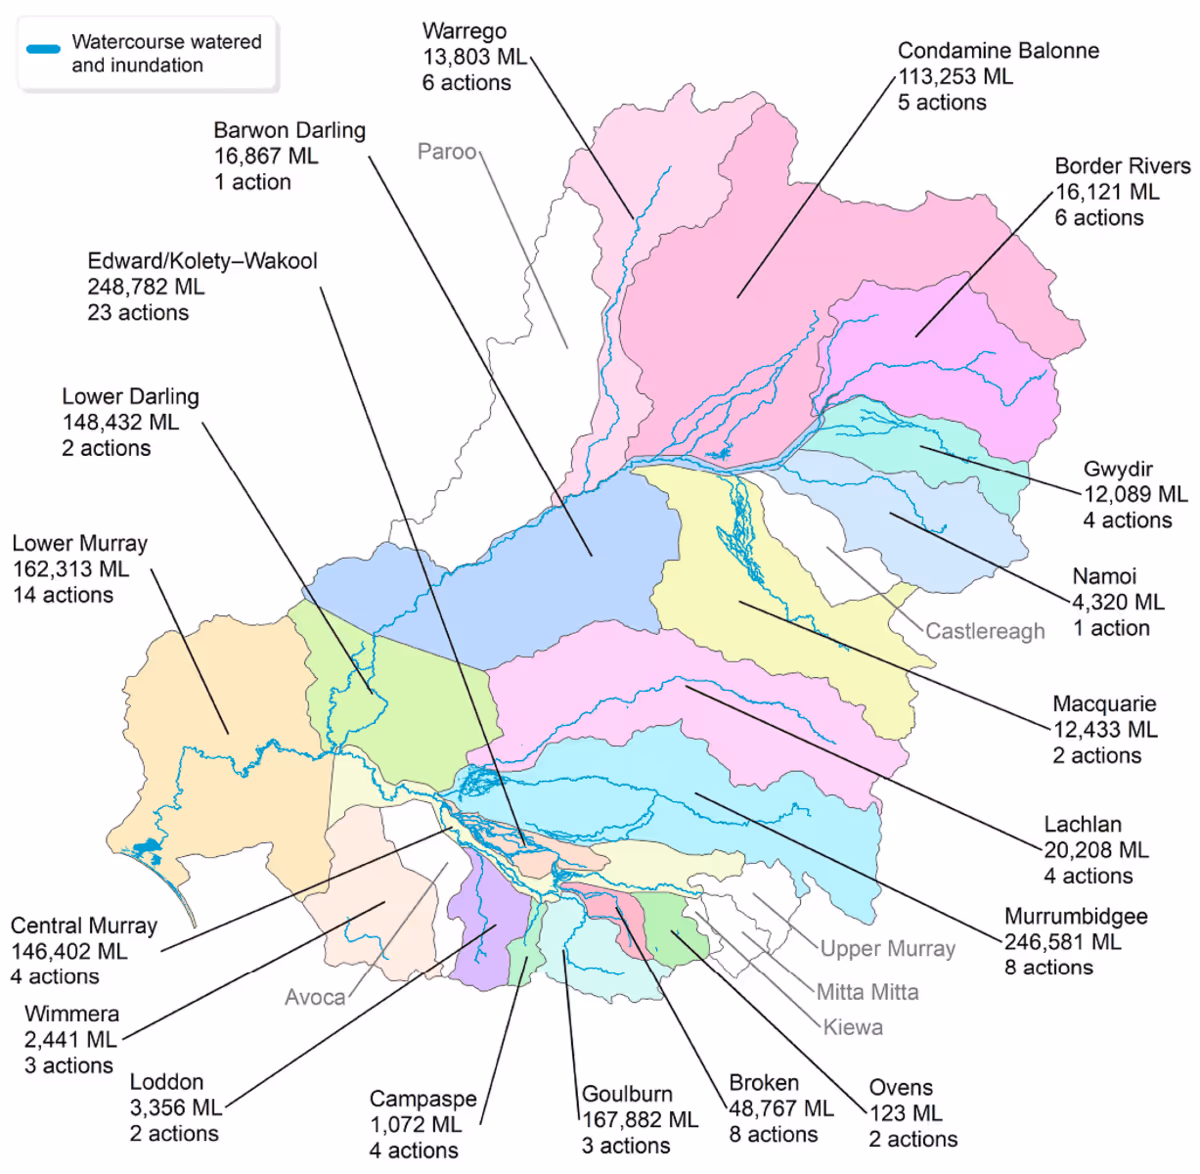
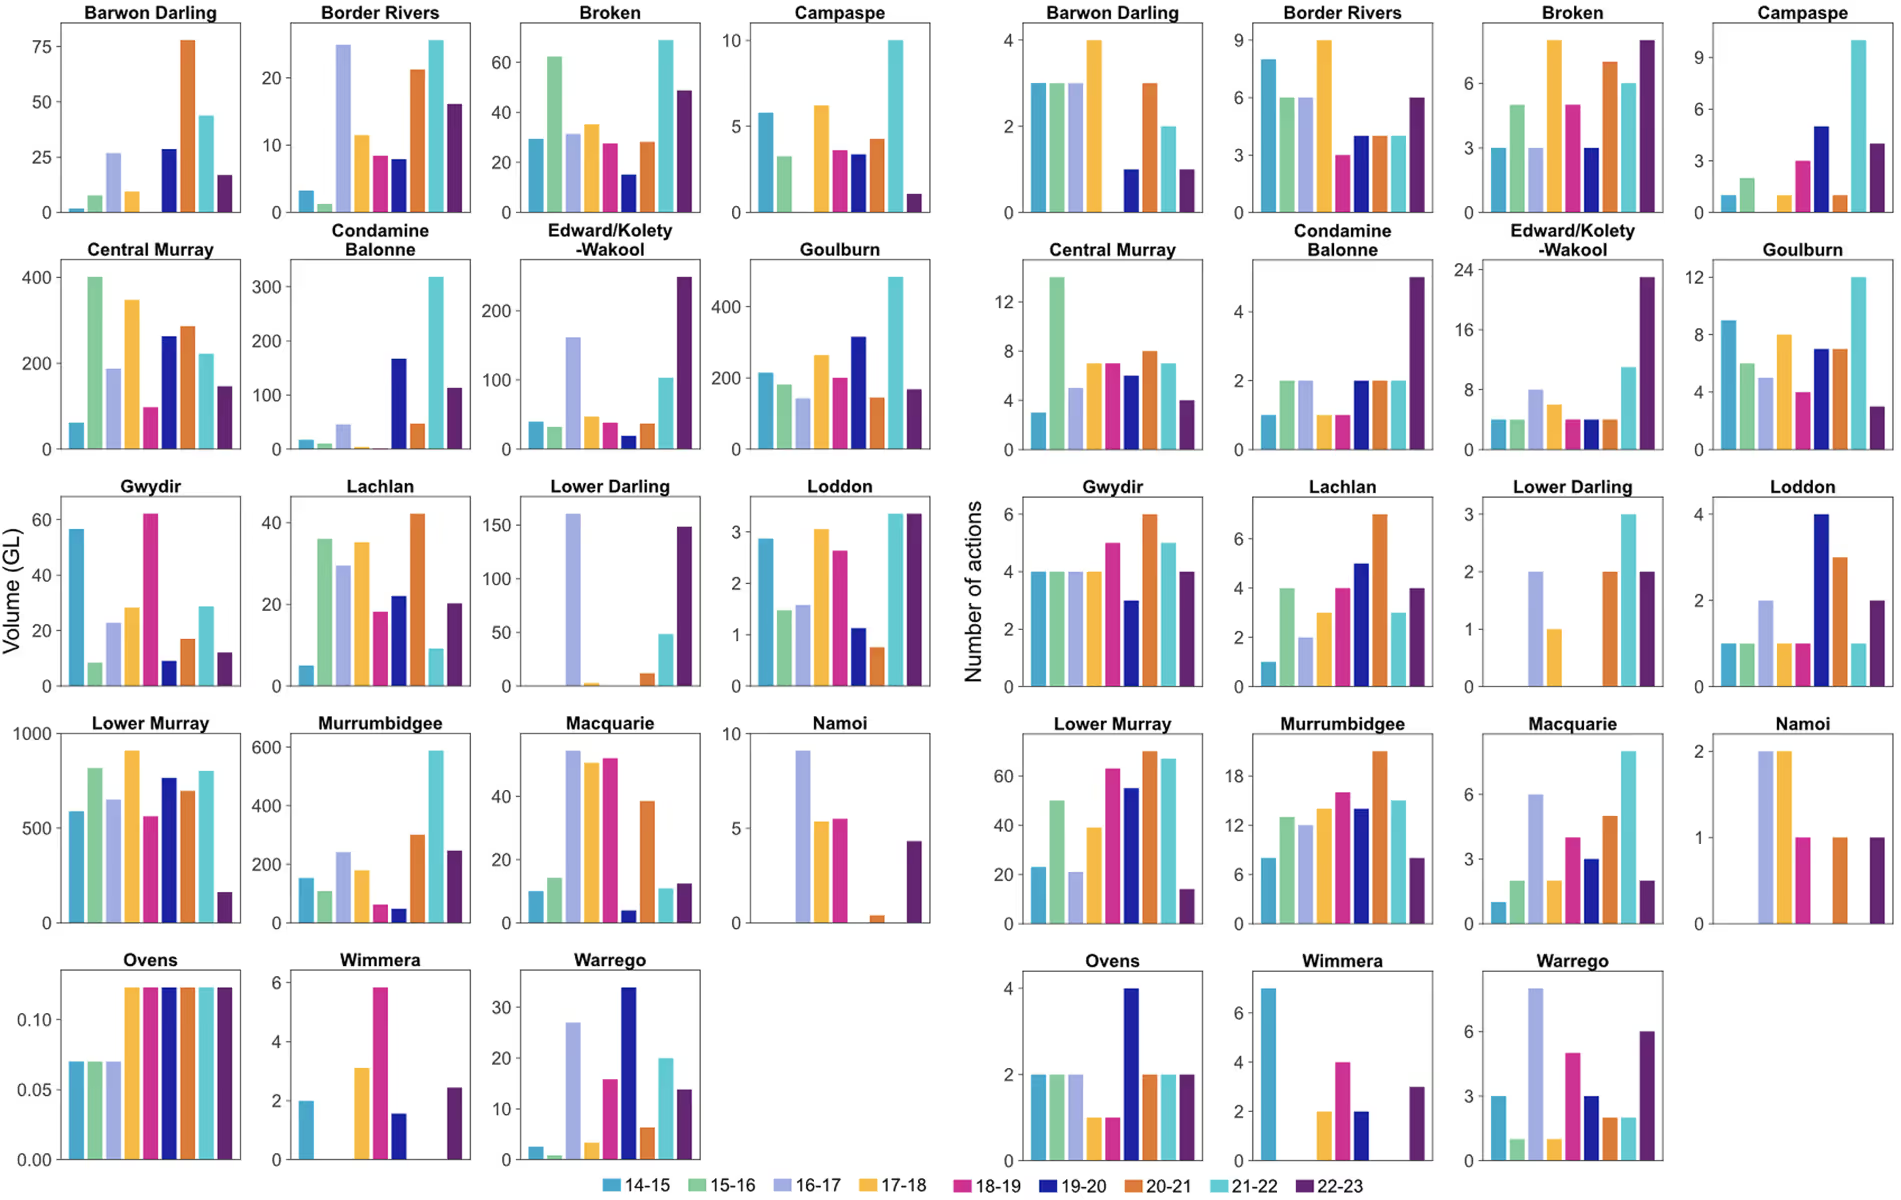
The southern Basin received most of the Commonwealth environmental water over this period, both in terms of volume and number of watering actions (Figure 3.7). In 2022–23, for instance, 86% of the water and 76% of the watering actions occurred in the southern Basin—reflecting a consistent trend across the 9-year period. Within the southern Basin, the Lower Murray Valley received the highest volume—5,953 GL through 402 actions. The Murrumbidgee, Central Murray, and Goulburn valleys also received substantial volumes of water.
In contrast, the Namoi Valley had the fewest actions, with just 7 recorded across the 9 years, while the Ovens Valley received the lowest total volume of water at 948 GL. In the northern Basin, the Condamine–Balonne Valley received the highest volume of environmental flows (43% of the northern total) from just 18 actions. Interestingly, the Border Rivers Valley had 50 watering actions, the most in the north, but received only 7% of the region's environmental water (pg.17).
Timing of Commonwealth Environmental Water Delivery (2014–23)
Across the 9 years of the monitoring program, Commonwealth environmental water was generally delivered with a similar seasonal pattern. Given the strong coordination between environmental water entitlement holders to deliver joint watering actions, any differences in timing are more likely a result of differences in this coordination rather than in strategies.
In general, over the 9 year monitoring period, most Commonwealth environmental water released in the Southern Basin was released in a spring and summer pulse, even in the drier years (water years 2017–20) (Error! Reference source not found.). Although during the drier years, more water was released during all seasons in the respective water years in the Southern Basin.
In the northern Basin, large winter and spring releases were more spread across the whole water year with large releases prevalent in a winter–spring pulse until the water year 2016–2017, after which releases were more prevalent in an autumn pulse. Like the southern Basin, during the dry years in the monitoring period in the northern Basin the releases were spread across all seasons in the respective water years (Guarino & Sengupta 2023) (pg.19).
Approach and Evaluation
The River Flows and Connectivity Theme evaluates the contribution of Commonwealth environmental water to the Basin Plan by addressing the following core question:
What did Commonwealth environmental water contribute towards the restoration of the hydrological flow regime?
Assessments are conducted at the site, valley, and Basin scales, focusing on these four key components of flow regime: base flow, freshes, inundation (lateral connectivity), and longitudinal connectivity.
- Base flows and freshes are estimated using gauging stations in valleys where Commonwealth environmental water has been delivered and where long-term watering plan thresholds for these flow components are available.
- Lateral connectivity is assessed by measuring the total area of floodplain inundated with Commonwealth environmental water.
- Longitudinal connectivity is evaluated by calculating the increase in end-of-valley flows attributed to the use of Commonwealth environmental water.
All of these are compared with the objectives and expected outcomes established in the Basin Plan and the Basin-wide environmental watering strategy (the Strategy). This evaluation is limited to Commonwealth environmental water; environmental water held by other holders is not evaluated and is out of scope for this report (pg. iii).
Objectives and Expected Outcomes
The Strategy (MDBA 2019) sets out expected environmental outcomes to improve connections along rivers and between rivers and their floodplains (pg. 1). These are listed in Table 1.1.
- 30% more into the River Murray
- 30–40% more to the Murray Mouth (and it open to the sea 90% of the time)
- By 10–20% in remaining catchments
To address the overarching evaluation question and evaluate whether the Strategy objectives are progressing or have been achieved, we have reformulated the Strategy objectives as questions. This will make our interpretation of the objectives explicit (pg. 3). The questions include:
Limitations of Basin-Scale Evaluation
There are important limitations to consider in interpreting the Basin-scale evaluation:
- Data sources and methods vary between jurisdictions. The disaggregation of Commonwealth environmental water from daily observed flows is carried out by different agencies, each using its own methodology. For example, New South Wales uses a water accounting model, while Queensland applies a point derivation method. These differences introduce variability and potential bias that must be considered.
- Inconsistent threshold availability. Attribution of flow components to the hydrological regime relies on thresholds defined in long-term watering plans. However, many valleys lack thresholds at all gauges, resulting in issues with consistency and comparability (pg. 3).
What have we learned
Water year: 2022–23
Commonwealth environmental watering was influenced by wet conditions for the 2022–23 water year, which resulted in higher natural flows that precluded many scheduled watering actions. Key findings include:
- Even with the wet conditions, this year saw the largest number of base flow actions, predominantly in the southern Basin valleys. A drier summer following a wet winter and spring required base flows to sustain connectivity.
- Commonwealth environmental water inundated 202,071 hectares of lakes and wetlands, 71,837 hectares of floodplains, and 23,768 hectares of estuary. In many cases, water was delivered to extend the duration of widespread natural flooding (e.g. in the Condamine Balonne, Lachlan, Gwydir, Macquarie, and Murrumbidgee valleys). Approximately 22,205 km of waterways were connected due to Commonwealth environmental water releases, with a noticeable increase in connectivity in many of the valleys.
Water Year 2014-23
- Flows over the last 9 years have been close to or slightly above the longer-term (23-year) average in the northern and southern Basins, mostly due to 3 of the 5 wettest years occurring in the last 9 years.
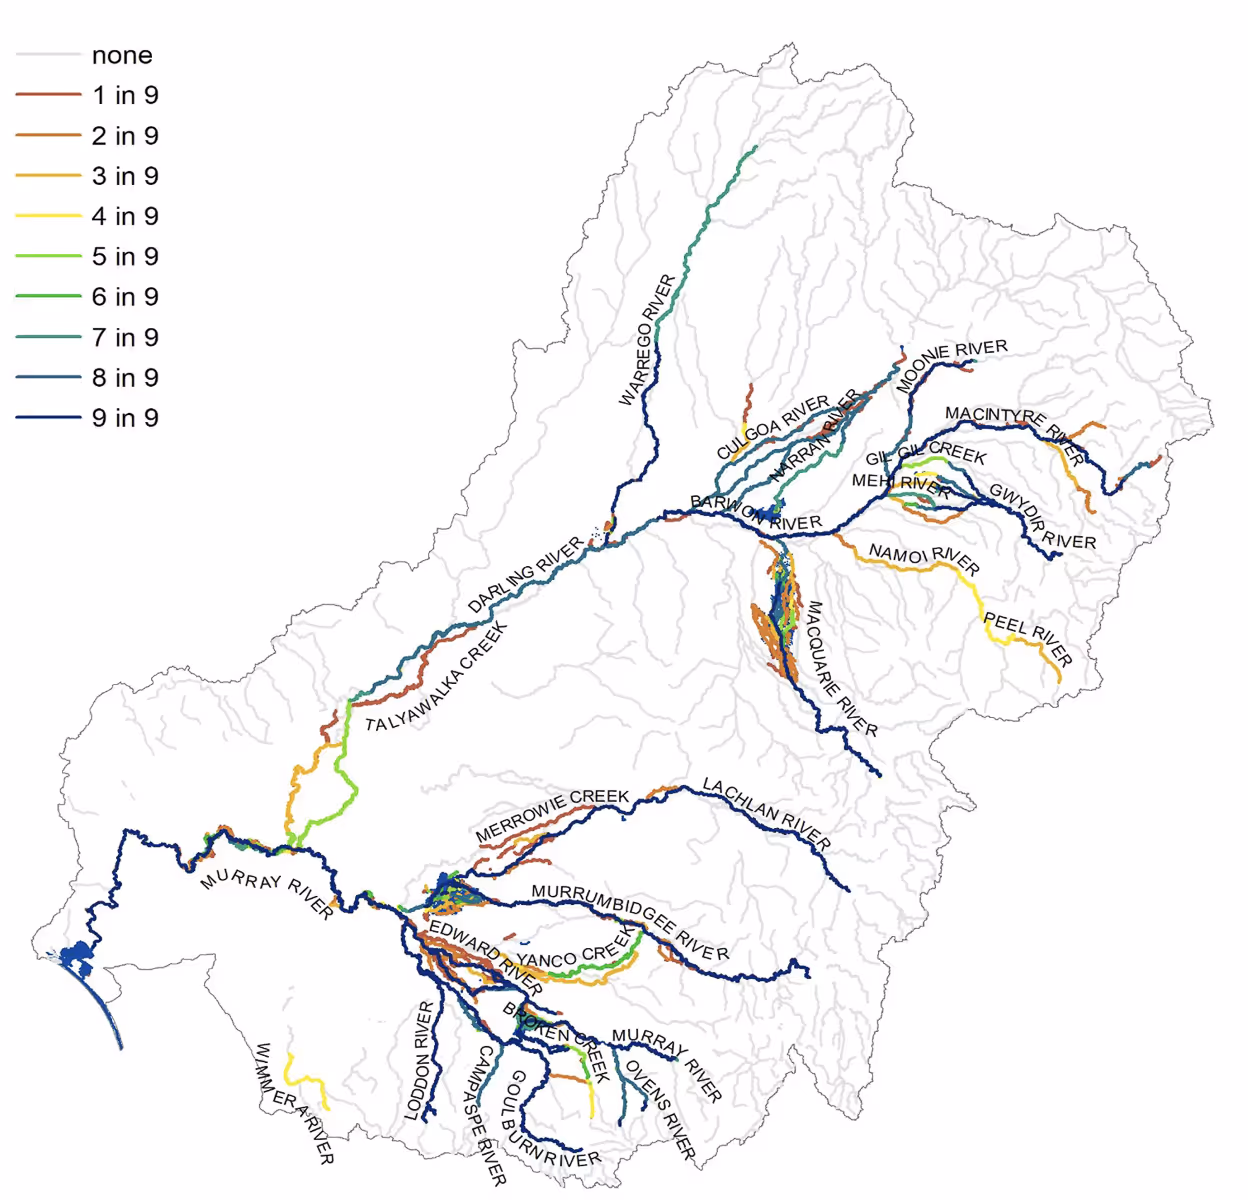
- Over the 9 years, Commonwealth environmental water has contributed flows to over 158,815 km of cumulative length of waterways, with a maximum extent in any one year of 27,715 km. Recent wetter years have generally shown higher connectivity, with Commonwealth environmental water (in conjunction with other flows) leading to greater achievement of environmental outcomes. The total length of waterways connected was highest in the Murrumbidgee, followed by the Barwon–Darling system. Even in wetter years, Commonwealth environmental water extended the duration of flows in some periods.
- Commonwealth environmental water comprised approximately 5.2% of the total flow volume in the Basin over the last 9 years through 1,081 individual watering actions. Of these actions, 36% were in collaboration with partners, with Commonwealth environmental water contributing around 15% of the partnered watering action.
- Commonwealth environmental water also assisted in improvements in lateral connectivity over the last 9 years, with a total of 456,282 hectares of wetlands and floodplains inundated. The Murrumbidgee received the largest 1-in-9-year inundation area of 57,947 hectares. In the northern Basin, the Macquarie and Condamine–Balonne systems received significant Commonwealth environmental water for inundation, whereas most valleys in the southern Basin benefitted from Commonwealth environmental water-influenced inundation in most years. In particular, the Lachlan, Central Murray, and Lower Murray benefitted from significant Commonwealth environmental water influencing inundation.
Informing adaptive management
In conclusion, the wet conditions of 2022–23 translated to a smaller portfolio of Commonwealth environmental water (1,385 GL) and 102 watering actions compared with 2,785 GL (160 watering actions) in 2021–22. However, the high number of base flow actions shows the real-time adaptive management in practice, where a drier summer prompted base flow deliveries to maintain connectivity. Inundation watering actions were delivered to increase the duration of the natural floods to maximise ecological outcomes. Where available, comparison with the pre-development regime shows that Commonwealth environmental water deliveries progressed the current year’s regime towards a more natural regime (pg.v).
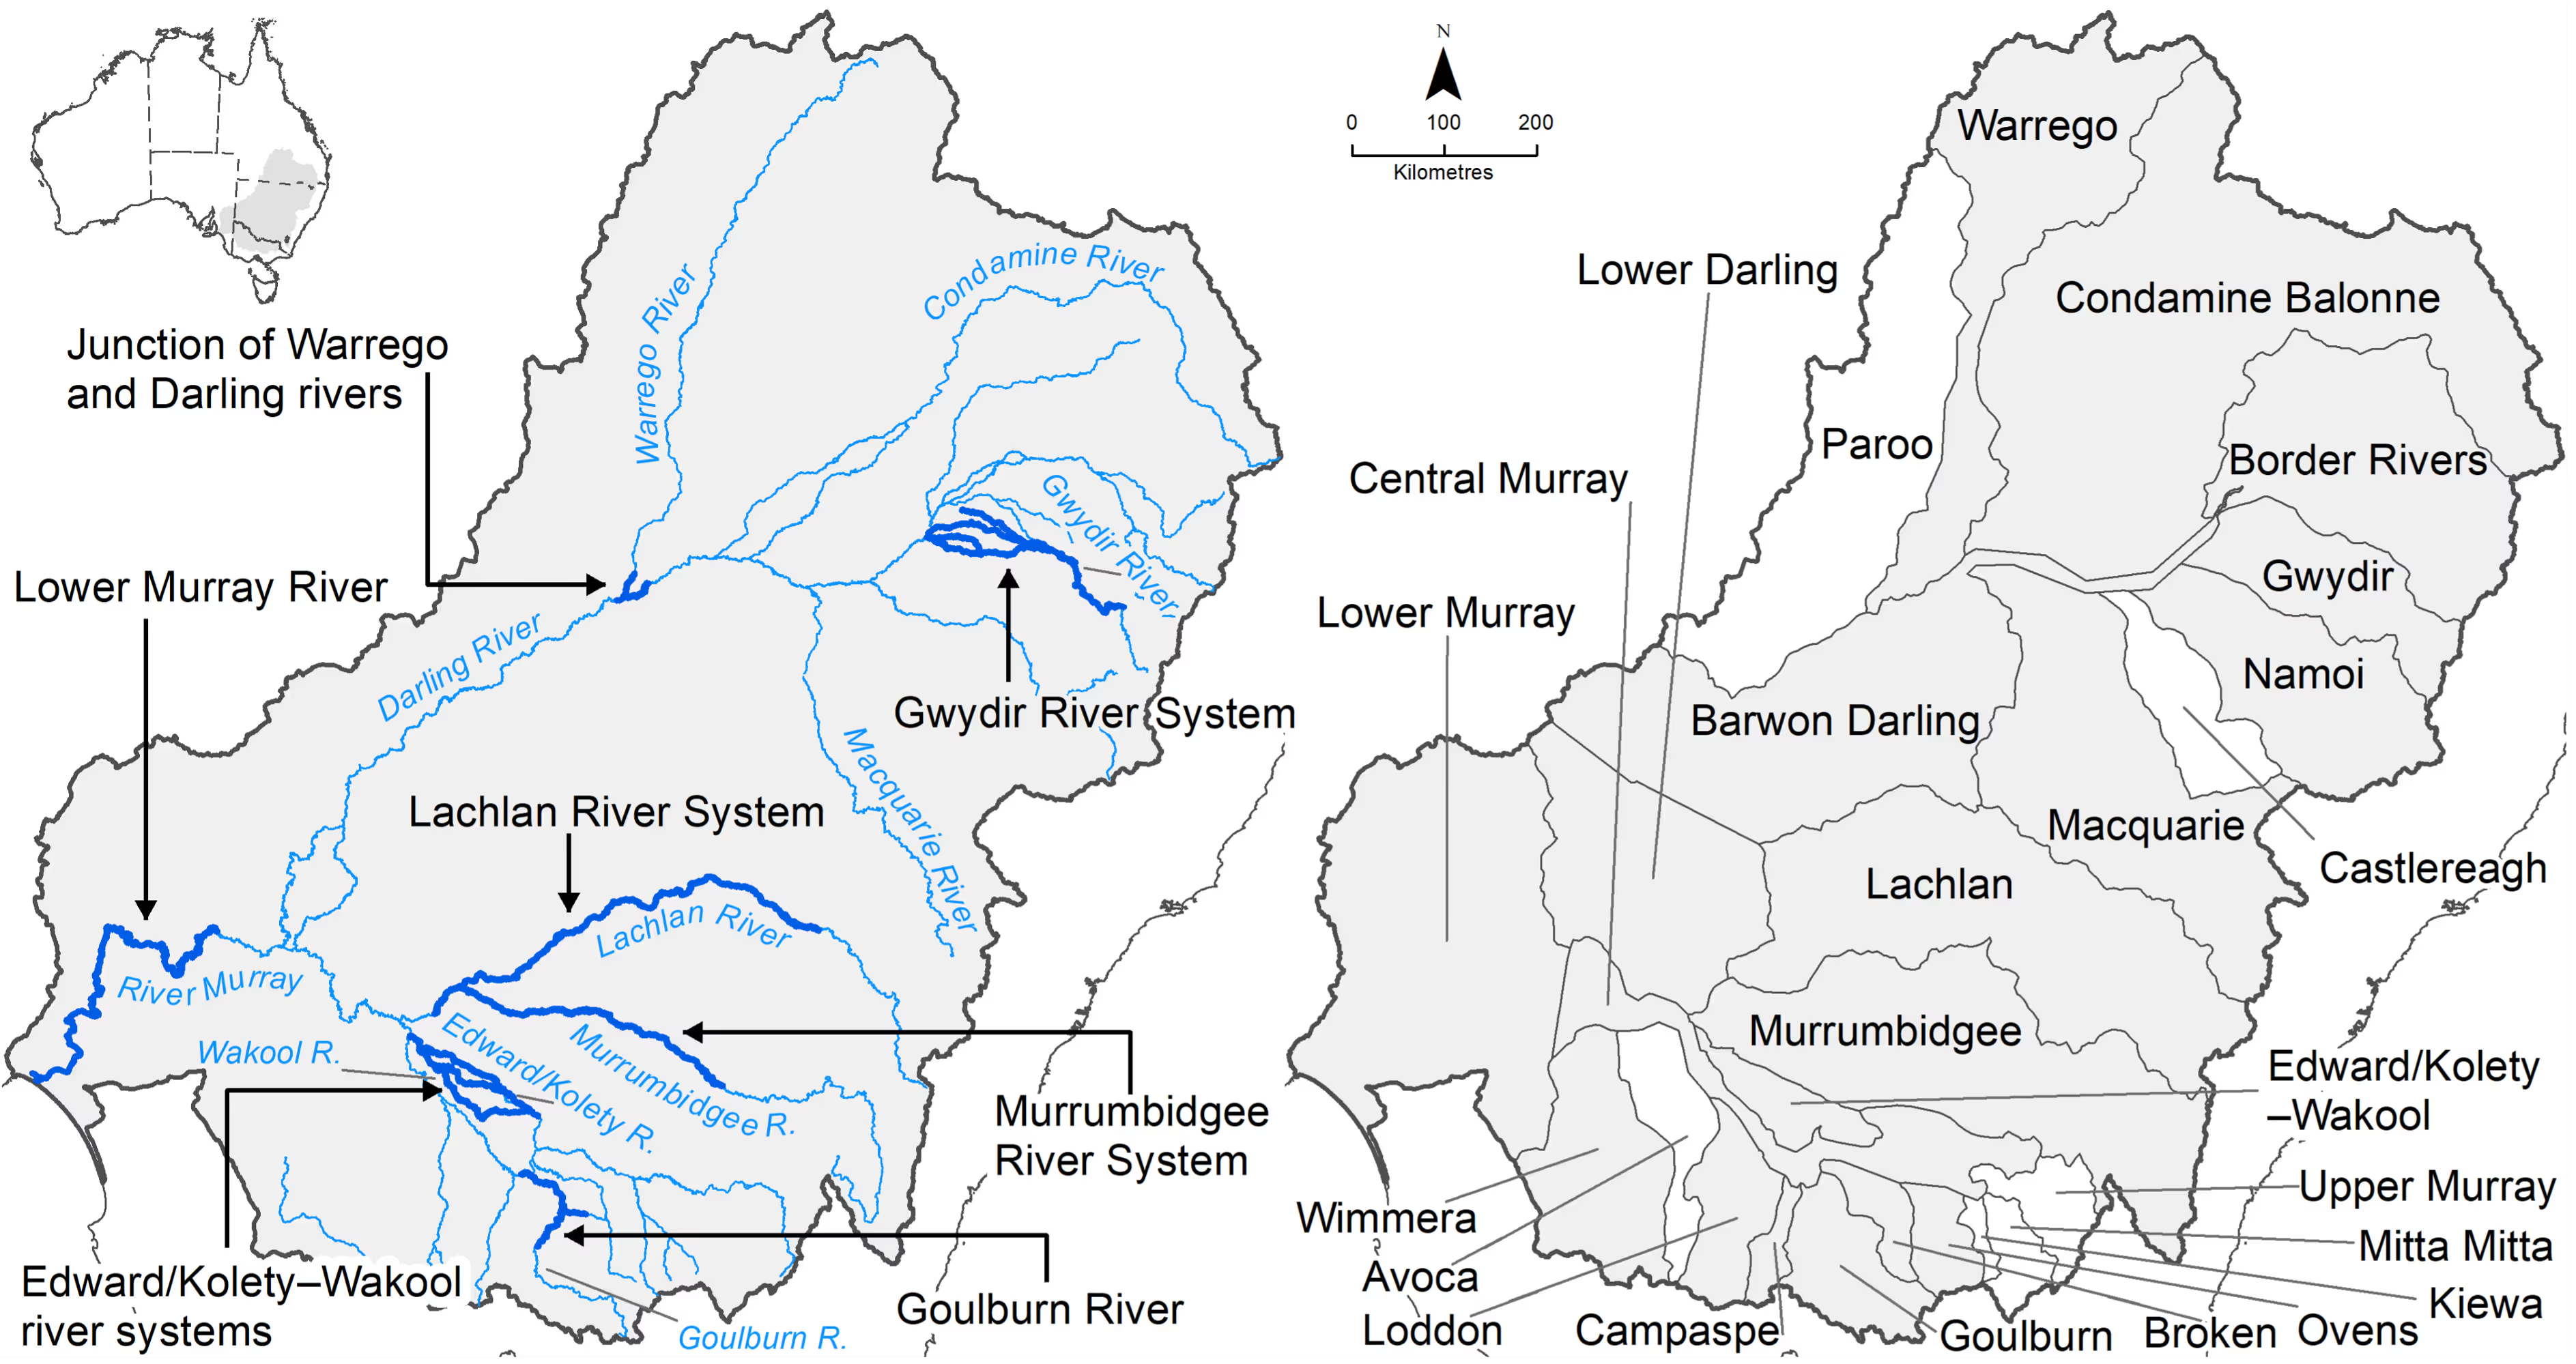
Evaluation coverage
This evaluation uses the map of 25 major river valleys that was developed for the Long Term Intervention Monitoring (see Figure 2), which were derived from the Sustainable Rivers Audit catchment boundaries. In this evaluation, only 19 of these valleys were used due to Commonwealth water entitlements.
Hydrological outputs are synthesised at the Basin scale and, when pertinent, are presented in relation to the northern Basin and southern Basin, as well as at valley scale. Climatic conditions are provided to set context for the watering actions for the water year (pg.3).
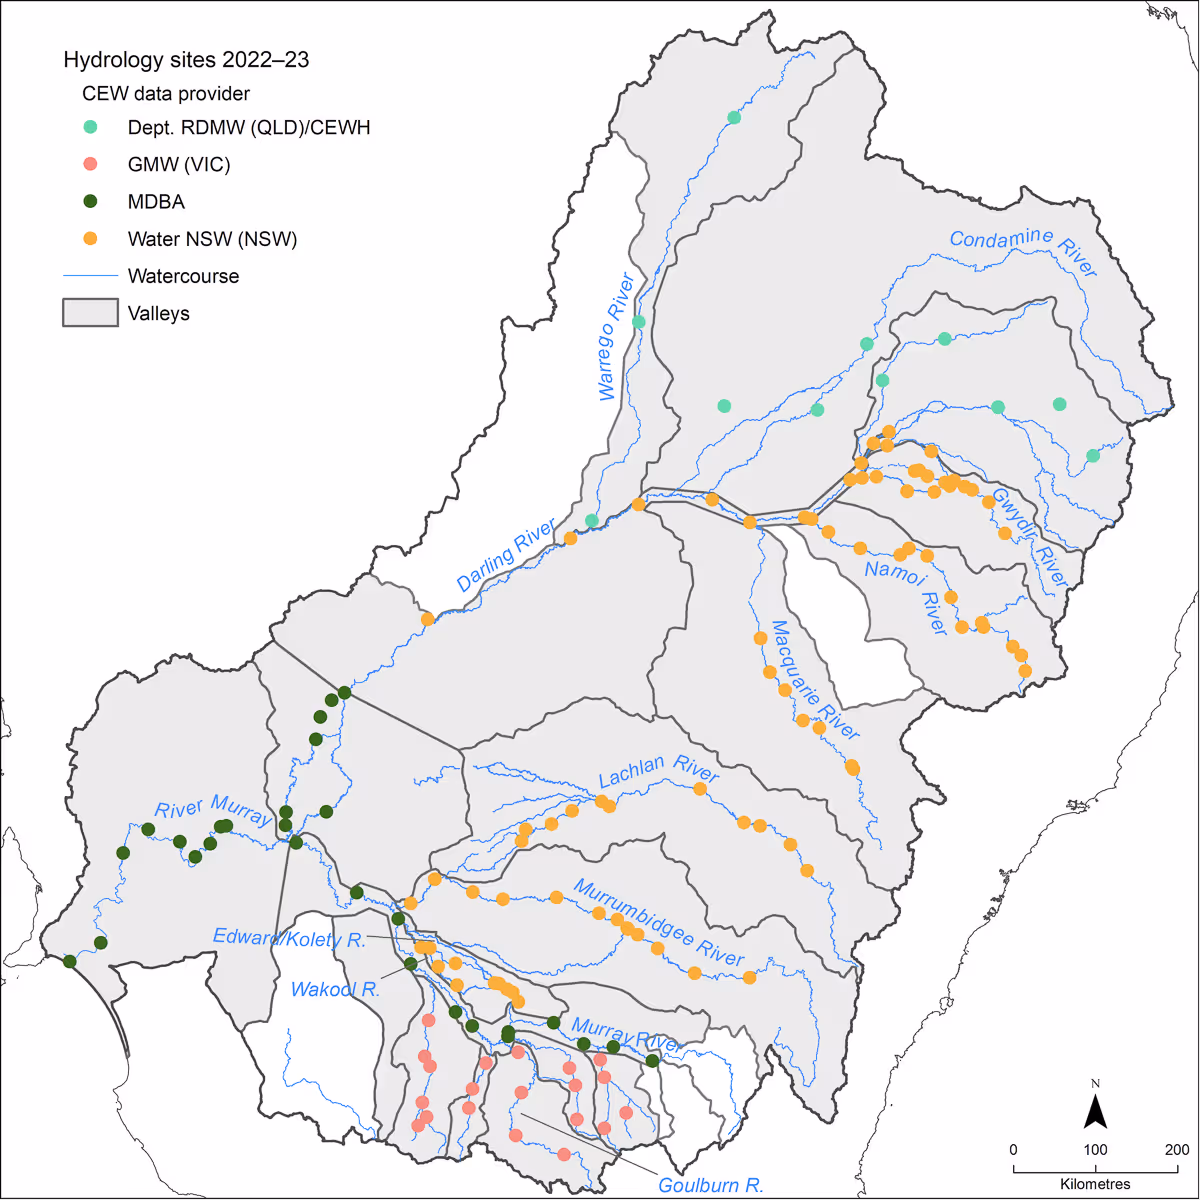
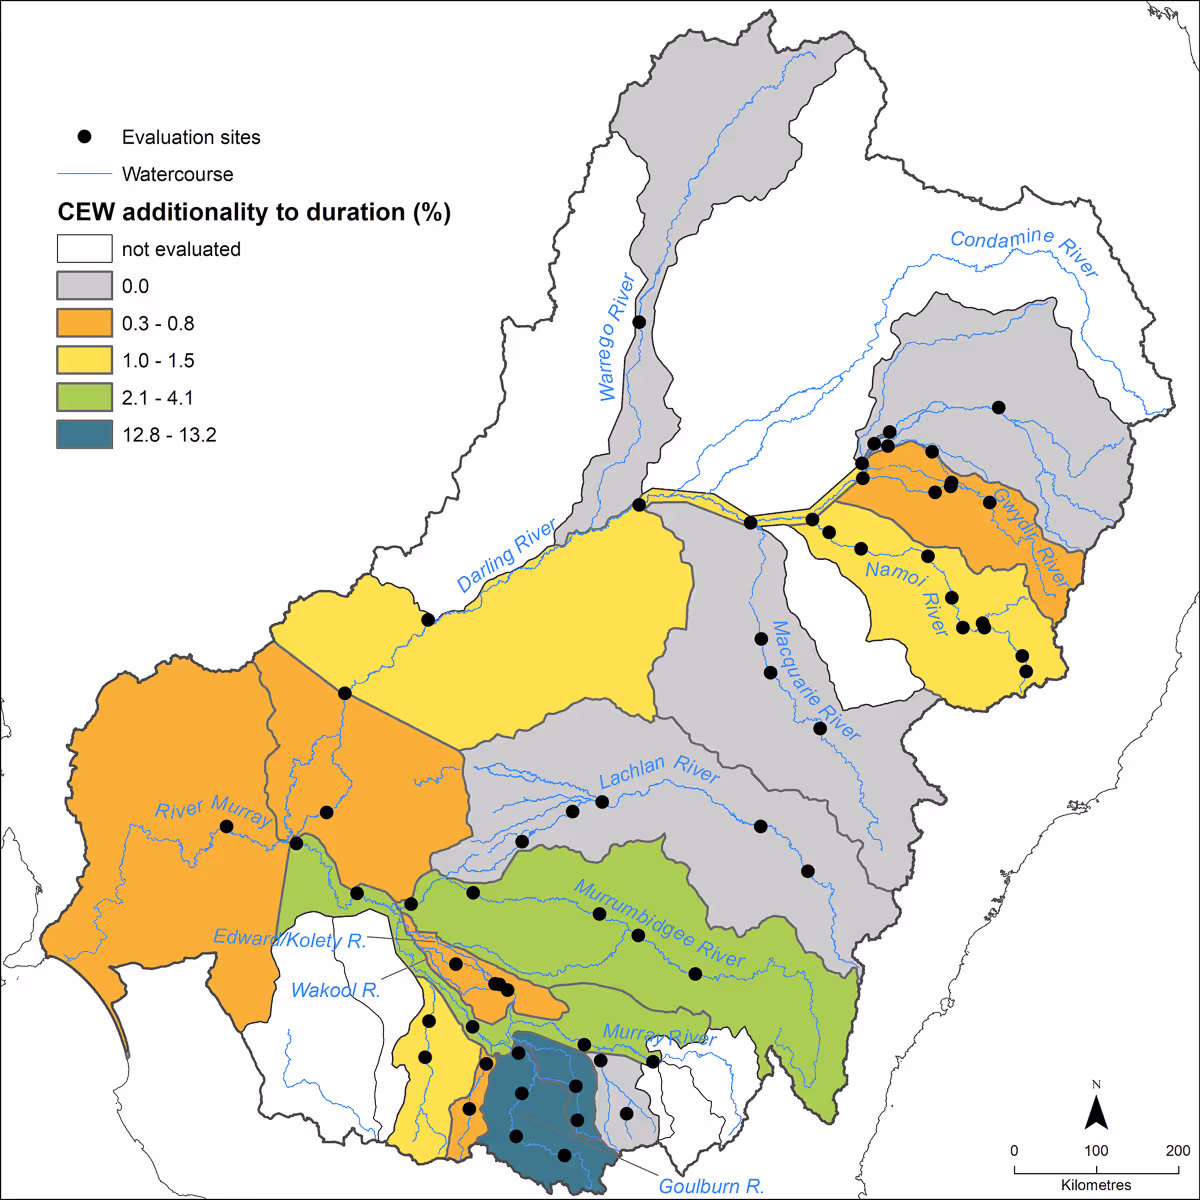
The CEWH prepares an annual watering actions dataset (CEWH 2023) which, along with the valley acquittal reports prepared by CEWH delivery teams, provides the base information (e.g. total volume and release periods) for each Commonwealth environmental water release. In addition, for each watering event, the daily flow volumes of Commonwealth environmental water at each gauge are sourced from various state and federal agencies. These data are used to estimate the ‘counterfactual flow’, which is a hypothetical daily streamflow time series with no Commonwealth environmental water. Point locations of these gauge sites, coloured by data supplier, are shown in Figure 1.2.
For each valley, 2 measures are estimated for base flows – very low base flow and low base flow; and 2 measures for freshes – low fresh and high fresh (pg.4).
Contextual data
Each year, the River Flows and Connectivity evaluation considers rainfall, climate and in-flow data as context for the evaluation.
Rainfall
In the 2022–23 water year, rainfall patterns differed between the northern and southern parts of the Basin. The northern Basin generally received average to above average rainfall, while the southern Basin experienced very much above average rainfall. However, rainfall varied both across and within valleys.
In the southern Basin, all 12 valleys recorded very much above average rainfall compared to the full historical record held by the Australian Bureau of Meteorology (see Figure 3.1).
Rainfall also varied over time. Many southern valleys had very much above average rainfall during winter, followed by a dry start to 2023. These patterns affected how Commonwealth environmental water was delivered. Many planned actions were not carried out due to high natural flows, while base flow events were delivered in the southern Basin during summer
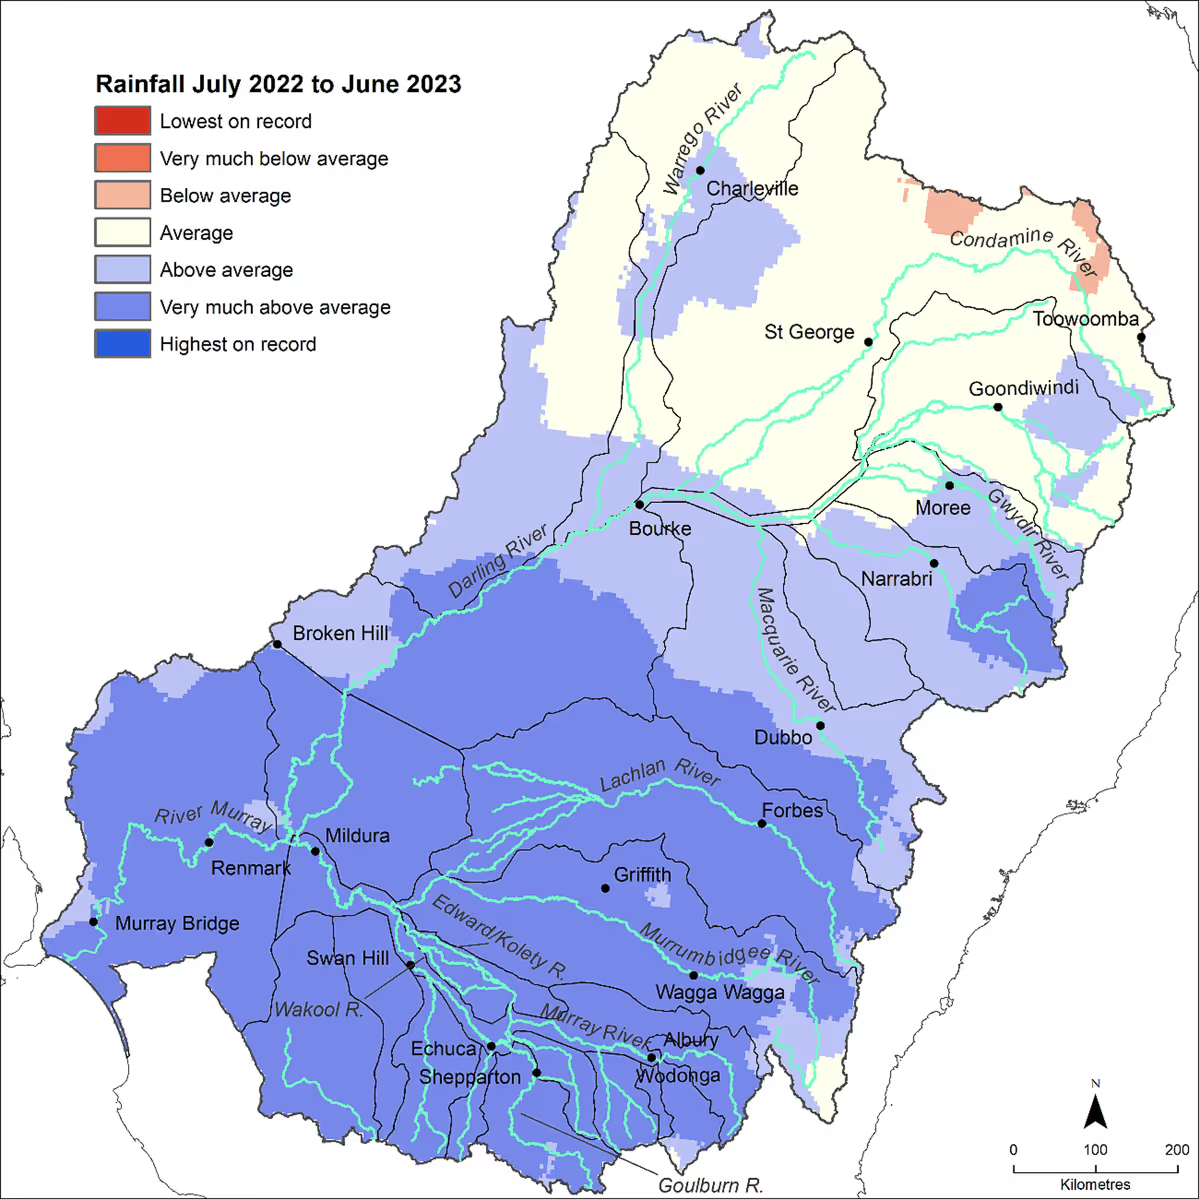
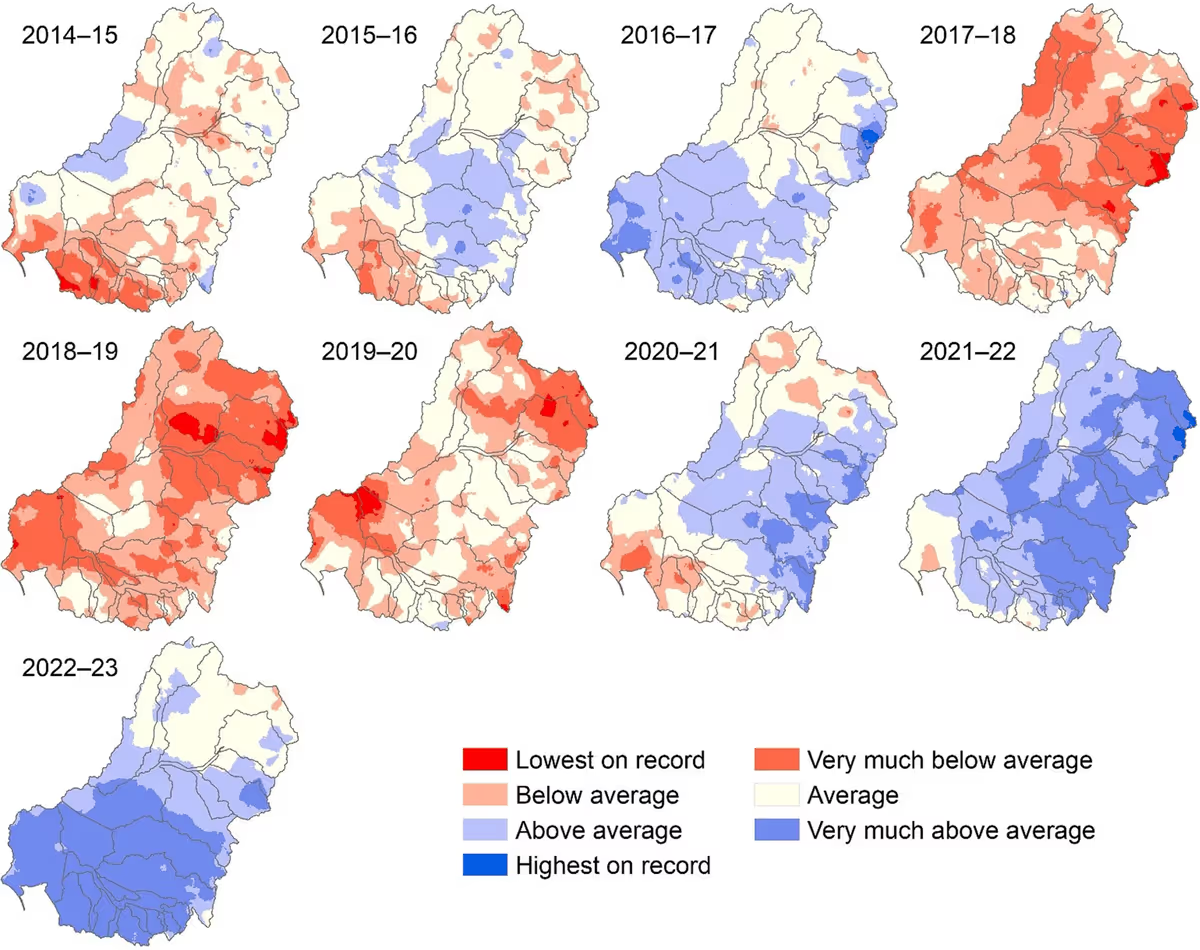
Figure 3.2 depicts the annual rainfall conditions in the Basin for each water year 2014–23. The first 2 years saw particularly dry conditions in the southern Basin. In 2016–17, there were wetter conditions in the southern Basin and along the headwaters of the New South Wales tributaries in the northern Basin. Conditions returned to dry over the period 2017–20 across the whole Basin. In 2020–23, conditions were again wetter, with average, above average and very much above average conditions experienced across the Basin (pg.10).
Surface water runoff
In 2022–23, total runoff in the Murray–Darling Basin reached 67,760 GL—more than double the 9- and 23-year averages—due to saturated soils and very high rainfall, especially in the southern Basin. Storage levels were already high at the start of the year and reached full capacity during the year.
Runoff in the northern Basin was 26,952 GL, the fourth highest since 2000–01, with most valleys above average except the Paroo and Warrego. In the southern Basin, runoff was 40,808 GL—more than twice the long-term average and the second highest in over two decades. The Lachlan, Murrumbidgee, and Upper Murray valleys saw exceptionally high runoff.
Despite the wet conditions, 1,385 GL of Commonwealth environmental water was delivered during drier periods, representing about 2% of total runoff (pg.11).
Meeting the Basin Plan Environmental Objectives
These outcomes evaluate the contribution ofCommonwealth environmental water to flow regimes and wetland inundation at aBasin scale, guided by the Basin Plan and assessed against the Basin-WideEnvironmental Watering Strategy.
The Hydrological targets include flowregime comparison, hydrological connectivity and the condition of the Coorong,Lower Lakes and Murray Mouth opening regime (pg.20).
Base Flows 2022-23
In 2022–23, base flow actions were highest compared with other components, with 33 dedicated base flows events – all in southern Basin valleys – in addition to 16 multi-component flow events. However, across the Basin, excessive periods of reduced base flows were mainly avoided due to the widespread wet conditions (pg.21).
Key findings include:
- Valleys evaluated in the northern Basin had flows above the very low base flow threshold for most of the year (more than 350 days).
- In the southern Basin, the duration of flow above the very low base flow threshold was also sustained for most of the year.
- All valleys except for the Broken and Warrego received flow above the low base flow threshold for most of the year, exceeding 300 days. The Broken system saw flows above the threshold for about half the year (172 days), and the Warrego for more than 60% of the year (235 days).
- In the northern Basin, Commonwealth environmental water added small quantities to the duration of the low base flow.
- In the southern Basin, Commonwealth environmental water contributed more substantially to achieving flows above the low base flow threshold, specifically in the Broken and Goulburn systems.
- Flow durations above the very low and low base flow thresholds for most of the year—and the relatively low contribution of Commonwealth environmental water in some areas—reflect the wet climatic conditions in 2022–23.
Freshes 2022-23
Dedicated watering actions targeting the fresh flow component were third highest, with 18 watering actions and 29 multi-component actions that included fresh flows (pg.25).
Key findings include:
- The duration of flow above the low fresh and high fresh thresholds varied substantially across the Basin depending on the valley.
- In the southern Basin, the duration of flow above the low fresh threshold was similar across most assessable valleys (around 300 ± 50 days), except for Campaspe (65 days) and Edward/Kolety–Wakool (204 days).
To see base flow and fresher trends from 2014-2023, please see page 30 in the 2022-23 Hydrology Report.
Lateral Connectivity 2022–23
In 2022–23, Commonwealth environmental water helped inundate wetlands and floodplains across many parts of the Basin (pg.33). This included:
- 202,071 hectares of lakes and wetlands
- 71,837 hectares of floodplains
- 23,768 hectares of estuary (see Table 4.3)
In Victoria, water delivered to the Broken, Campaspe, Goulburn, Loddon, Ovens, and Wimmera rivers remained within river channels, benefiting in-channel weir pools and connected wetlands. A similar pattern occurred in the northern Basin, with in-channel flows observed in the Namoi, Barwon–Darling, and Border Rivers valleys.
The largest areas of wetland and floodplain inundation came from Commonwealth environmental water used to extend natural flooding in valleys such as the Condamine–Balonne, Lachlan, Gwydir, Macquarie, and Murrumbidgee.
In the southern Basin, environmental water increased the total inundated area compared to previous years (pg.33).
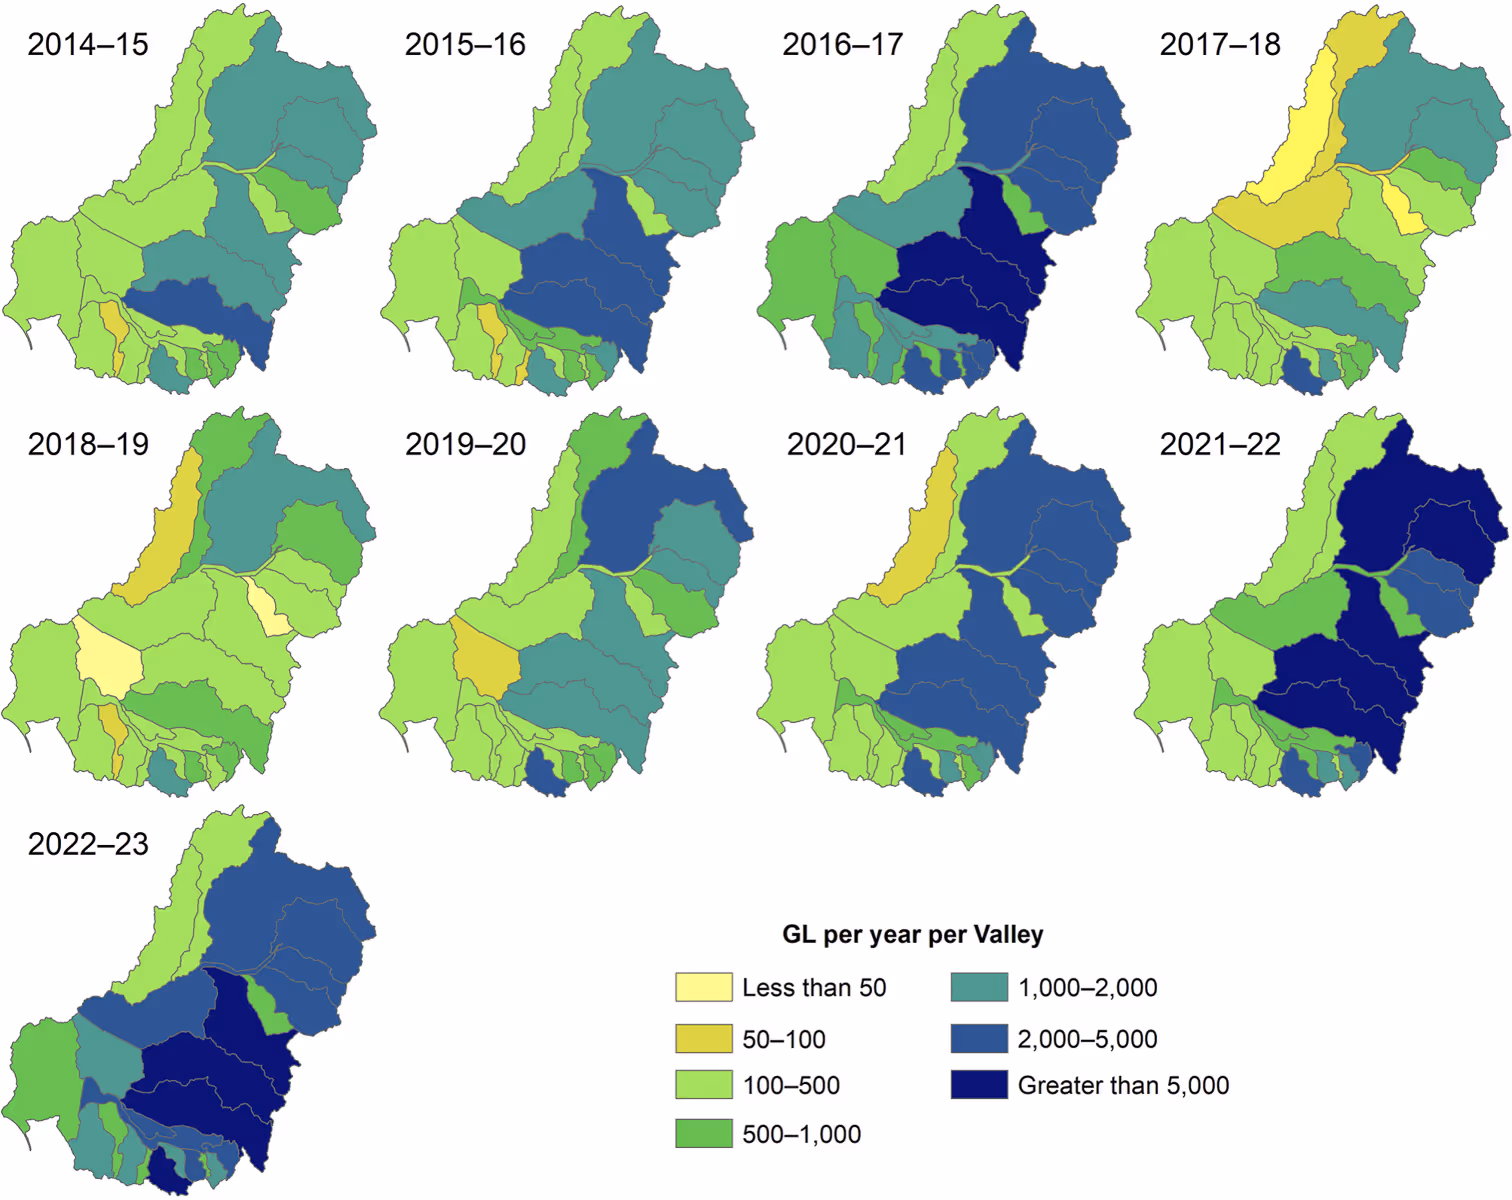
Lateral Connectivity 2014–23
Over the 9-year monitoring period, Commonwealth environmental water contributed to inundation across 456,282 hectares of wetlands, lakes, and floodplains—including the Coorong, Lower Lakes, and Murray Mouth.
The Murrumbidgee Valley had the largest single-year inundation (1-in-9-year event) with 57,497 hectares watered. Significant inundation also occurred in the Macquarie and Condamine–Balonne valleys. In the southern Basin, most valleys received environmental water in most years, with large areas watered in the Lachlan, Central Murray, and Lower Murray valleys (pg.34).
Longitudinal Connectivity 2022–23
In 2022–23, Commonwealth environmental water contributed to connectivity along approximately 22,205 km of waterways.
In the northern Basin, improved connectivity was seen in the Barwon–Darling, Condamine–Balonne, Border Rivers, Macquarie, and Warrego valleys.
In the southern Basin, increased in-channel connectivity was recorded in the Central Murray, Edward/Kolety–Wakool, Lachlan, Lower Darling, Lower Murray, and Murrumbidgee valleys (pg.35).
Longitudinal Connectivity 2014–23
Over the 9-year period, Commonwealth environmental water supported about 158,815 km of longitudinal connectivity, with a maximum extent of 27,715 km in one year.
Connectivity was highest in wetter years, often supported by other natural or managed flows. Lowland streams, both permanent and temporary, were the most frequently connected stream types during environmental flow events (pg.35).
Evaluation against Basin-Wide Environmental Watering Strategy environmental outcomes
Lateral Connectivity
The Basin-Wide Environmental Watering Strategy measures lateral connectivity by comparing how often freshes and bankfull events occurred in the observed scenario (with Commonwealth environmental water) versus a counterfactual scenario (without it). In this assessment, only the frequency of high freshes was considered. Bankfull and overbank events were not included, as environmental flows rarely contribute to flows large enough to fill the river channel.
In 2022–23, many fresh and wetland watering actions focused on extending the duration of flow events, not increasing how often they occurred. As a result, most valleys showed no increase in the frequency of freshes due to Commonwealth environmental water.
There were two exceptions:
- The Edward/Kolety–Wakool Valley (not listed in the official outcomes) saw a 22% increase in fresh frequency due to Commonwealth environmental water.
- The Goulburn–Broken Valley saw a 17% increase (Table 5.2).
As 2022–23 was extremely wet, many freshes occurred naturally, so environmental water was not needed to meet the target in most places. It’s also important to note that this evaluation looks only at Commonwealth environmental water, though other environmental water holders also contributed to flows (pg.38).
Longitudinal Connectivity
In 2022–23, base flows were higher and lasted longer than in the pre-development scenario. As a result, the Strategy outcome for base flows was met in all valleys. This was largely due to the extremely wet conditions across the Basin during the evaluation year (pg. 39). While Commonwealth environmental water helped, it was not the main contributor to this outcome. However, the Strategy objective is based on comparing the duration of flows above the low base flow threshold with the duration in the pre-development scenario. A key caveat is that the very wet conditions in 2022–23 were compared against relatively dry average pre-development conditions, which can affect interpretation.
We also assessed whether Commonwealth environmental water contributed to a 10% increase in base flows at Bourke on the Barwon–Darling River, which is the first monitoring site downstream of all northern Basin valleys. Flows from the Warrego River were not included in this analysis, although only a small volume (14 GL) of Commonwealth water was delivered there in 2022–23, mainly to the Toorale floodplain, upstream of the Barwon confluence.
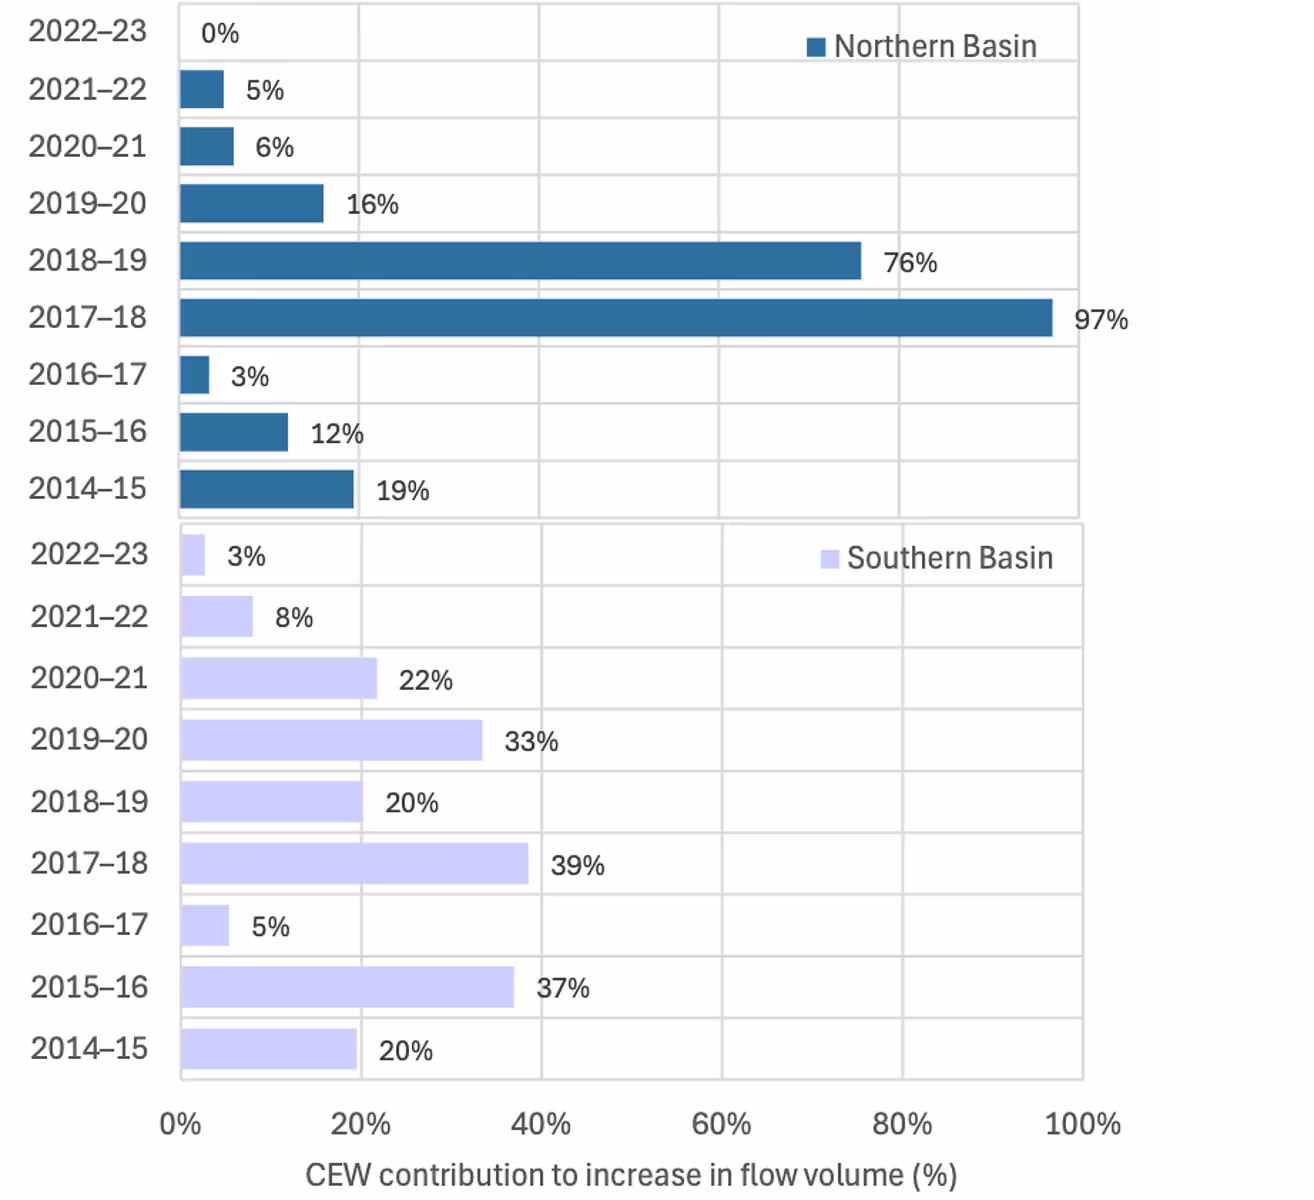
In 2022–23, Commonwealth environmental water led to only a 0.01% increase in annual base flows in the northern Basin (Figure 5.1). This small percentage is due to the very high natural flows from wet conditions, which meant less environmental water was needed. In contrast, during dry years, the contribution is much more significant. For example, in 2017–18, Commonwealth environmental water made up 97.1% of the total flow in the northern Basin (Figure 5.1).
In the southern Basin, the expected outcome is a 30% increase in Murray River flows. In 2022–23, Commonwealth environmental water contributed 2.7% of total flow, measured at the South Australian border.
The final expected outcome is a 30–40% increase in flows to the Murray Mouth. In 2022–23, a 3.4% increase was recorded, based on measurements at Wellington (Figure 5.1).
End of Basin Flows
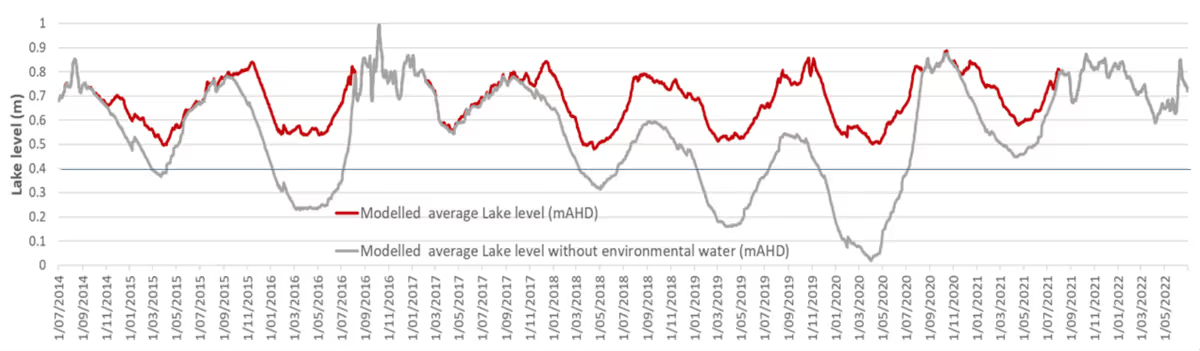
In 2022–23, end-of-Basin flows reflected a wet year, with barrage flows exceeding the required 2,000 GL per year and water levels above 0.4 metres Australian Height Datum (AHD) for the entire year. Details of these outcomes are shown in Table 5.4.
The Commonwealth environmental water contributed 753 GL to the total barrage flows during the year (Table 5.5). Another requirement is that the average barrage flow over two years must be at least 600 GL per year, which was also met.
Water levels in the Lower Lakes remained above 0.4 m AHD for the whole year. Figure 5.2 shows water levels in Lake Alexandrina (one of the two Lower Lakes), reaching up to 1.15 m AHD in summer (pg.41).